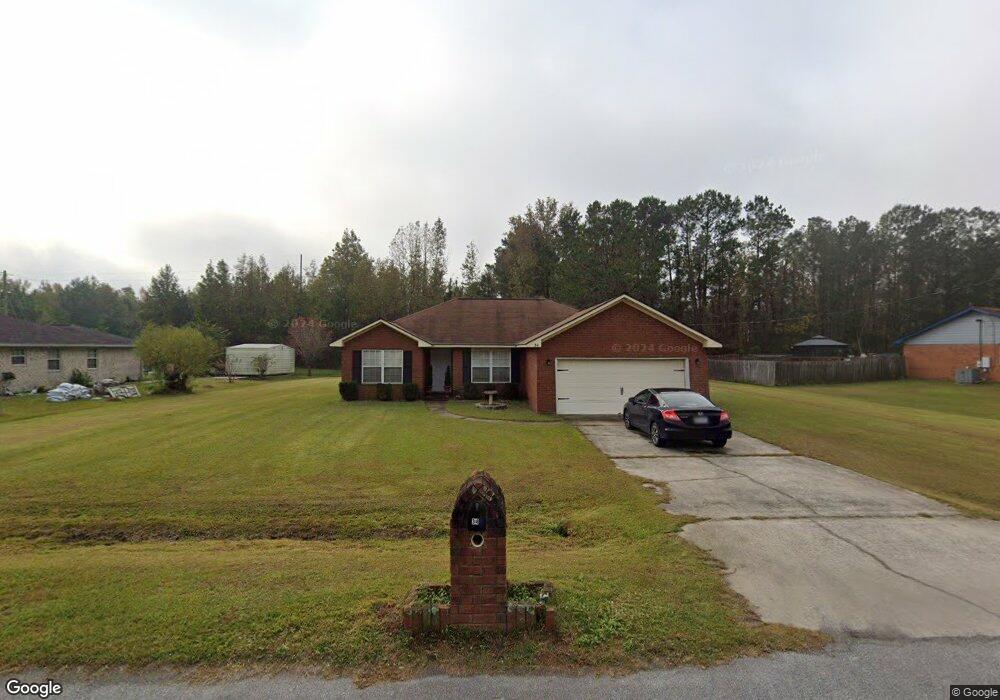
34 W Red Fox Ct Midway, GA 31320
Estimated Value: $224,000 - $270,000
3
Beds
2
Baths
1,450
Sq Ft
$173/Sq Ft
Est. Value
About This Home
This home is located at 34 W Red Fox Ct, Midway, GA 31320 and is currently estimated at $250,534, approximately $172 per square foot. 34 W Red Fox Ct is a home located in Liberty County with nearby schools including Liberty Elementary School, Midway Middle School, and Liberty County High School.
Ownership History
Date
Name
Owned For
Owner Type
Purchase Details
Closed on
Feb 25, 2016
Sold by
Snyder Thomas
Bought by
Equity Trust Co Custodian and Licavoli Christopher Ira
Current Estimated Value
Home Financials for this Owner
Home Financials are based on the most recent Mortgage that was taken out on this home.
Original Mortgage
$137,902
Outstanding Balance
$109,654
Interest Rate
3.79%
Mortgage Type
Commercial
Estimated Equity
$140,880
Purchase Details
Closed on
May 11, 2015
Sold by
Thomas Thomas J and Thomas Irma
Bought by
Equity Trust Company Custodian Fbo Thoma
Purchase Details
Closed on
Apr 15, 1998
Sold by
Holland Homes
Bought by
Thomas Thomas J and Thomas Irma
Purchase Details
Closed on
Aug 12, 1997
Sold by
Dykes Llenard
Bought by
Holland Homes
Purchase Details
Closed on
Jun 13, 1994
Bought by
Dykes Lenard
Create a Home Valuation Report for This Property
The Home Valuation Report is an in-depth analysis detailing your home's value as well as a comparison with similar homes in the area
Home Values in the Area
Average Home Value in this Area
Purchase History
| Date | Buyer | Sale Price | Title Company |
|---|---|---|---|
| Equity Trust Co Custodian | -- | -- | |
| Burton Michael D | $135,000 | -- | |
| Equity Trust Company Custodian Fbo Thoma | $60,000 | -- | |
| Thomas Thomas J | $81,000 | -- | |
| Holland Homes | -- | -- | |
| Dykes Lenard | -- | -- |
Source: Public Records
Mortgage History
| Date | Status | Borrower | Loan Amount |
|---|---|---|---|
| Open | Burton Michael D | $137,902 | |
| Closed | Equity Trust Co Custodian | $137,902 |
Source: Public Records
Tax History Compared to Growth
Tax History
| Year | Tax Paid | Tax Assessment Tax Assessment Total Assessment is a certain percentage of the fair market value that is determined by local assessors to be the total taxable value of land and additions on the property. | Land | Improvement |
|---|---|---|---|---|
| 2024 | $1,972 | $75,650 | $14,000 | $61,650 |
| 2023 | $1,972 | $66,338 | $12,000 | $54,338 |
| 2022 | $1,730 | $50,946 | $10,800 | $40,146 |
| 2021 | $1,657 | $46,900 | $10,800 | $36,100 |
| 2020 | $1,648 | $47,288 | $10,800 | $36,488 |
| 2019 | $1,480 | $43,189 | $10,000 | $33,189 |
| 2018 | $1,475 | $43,538 | $10,000 | $33,538 |
| 2017 | $1,777 | $41,888 | $8,000 | $33,888 |
| 2016 | $1,519 | $42,679 | $8,000 | $34,679 |
| 2015 | $1,807 | $42,679 | $8,000 | $34,679 |
| 2014 | $1,807 | $50,498 | $10,000 | $40,498 |
| 2013 | -- | $48,544 | $10,000 | $38,544 |
Source: Public Records
Map
Nearby Homes
- 296 River Bend Dr
- 327 River Bend Dr
- 364 River Bend Dr
- 8701 E Oglethorpe Hwy
- 0 E Oglethorpe Unit SA341930
- 0 E Oglethorpe Unit 153327
- 0 E Oglethorpe Unit 10592168
- 90 Charleston Ct
- 0000 E Oglethorpe Hwy
- 182 Gloucester Dr
- 0 S Coastal Hwy
- 2 Acres Walthour Rd
- 29 Sassafras Ln
- 984 Stone Ct
- 670 Stone Ct
- 35 Hollis Ln
- 152 Holland Dr
- 1019 Stone Ct
- 94 Buckingham Dr
- 1099 Stone Ct
- 60 W Red Fox Ct
- 14 W Red Fox Ct
- 35 W Red Fox Ct
- 13 W Red Fox Ct
- 59 W Red Fox Ct
- 74 W Red Fox Ct
- 11 E Red Fox Ct
- 73 W Red Fox Ct
- 34 W Beaver Ln
- 48 W Beaver Ln
- 12 E Red Fox Ct
- 9000 E Oglethorpe Hwy
- 9000 E Oglethorpe Hwy
- 14 W Beaver Ln
- 33 E Red Fox Ct
- 60 W Beaver Ln
- 34 E Red Fox Ct
- 8966 E Oglethorpe Hwy
- 11 E Beaver Ln
- 9041 E Oglethorpe Hwy