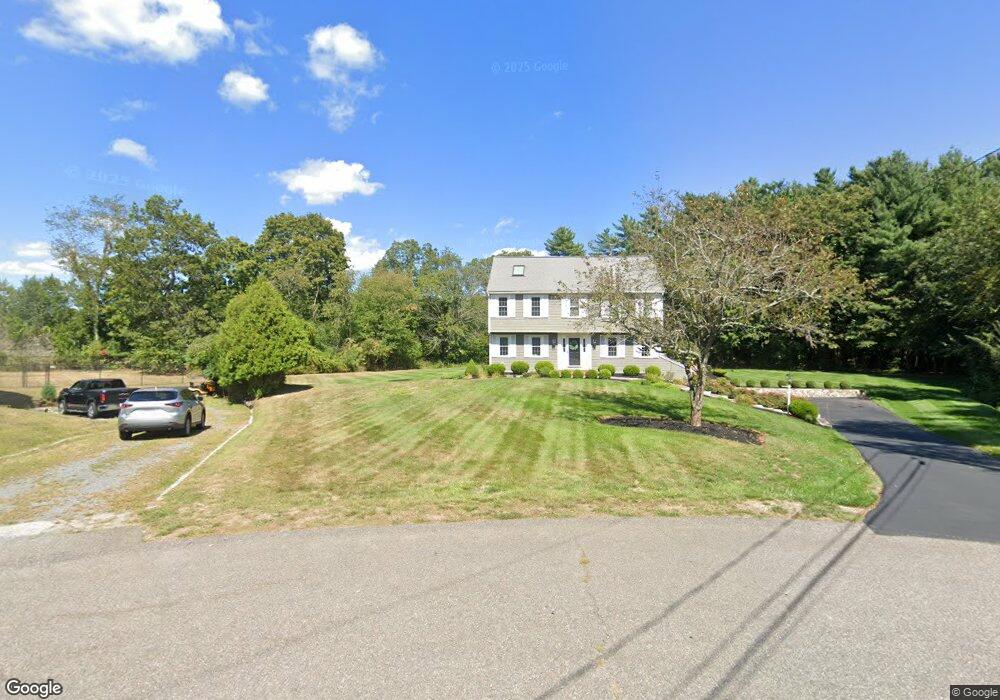
34 Wade Way Hanover, MA 02339
Estimated Value: $833,000 - $972,000
4
Beds
3
Baths
2,080
Sq Ft
$433/Sq Ft
Est. Value
About This Home
This home is located at 34 Wade Way, Hanover, MA 02339 and is currently estimated at $901,143, approximately $433 per square foot. 34 Wade Way is a home located in Plymouth County with nearby schools including Hanover High School, South Shore Charter Public School, and Norwell KinderCare.
Ownership History
Date
Name
Owned For
Owner Type
Purchase Details
Closed on
Apr 19, 2024
Sold by
Perez Luis E and Perez Jennifer A
Bought by
Luis Perez Lt and Perez
Current Estimated Value
Purchase Details
Closed on
Jan 6, 2023
Sold by
Miller Robert E and Miller Joanne
Bought by
Perez Luis E and Perez Jennifer A
Home Financials for this Owner
Home Financials are based on the most recent Mortgage that was taken out on this home.
Original Mortgage
$647,201
Interest Rate
6.58%
Mortgage Type
Purchase Money Mortgage
Purchase Details
Closed on
Nov 10, 1986
Bought by
Miller Robert E and Miller Joanne
Create a Home Valuation Report for This Property
The Home Valuation Report is an in-depth analysis detailing your home's value as well as a comparison with similar homes in the area
Home Values in the Area
Average Home Value in this Area
Purchase History
| Date | Buyer | Sale Price | Title Company |
|---|---|---|---|
| Luis Perez Lt | -- | None Available | |
| Luis Perez Lt | -- | None Available | |
| Perez Luis E | $769,000 | None Available | |
| Miller Robert E | $166,400 | -- |
Source: Public Records
Mortgage History
| Date | Status | Borrower | Loan Amount |
|---|---|---|---|
| Previous Owner | Perez Luis E | $647,201 | |
| Previous Owner | Miller Robert E | $404,300 | |
| Previous Owner | Miller Robert E | $170,000 | |
| Previous Owner | Miller Robert E | $294,000 |
Source: Public Records
Tax History
| Year | Tax Paid | Tax Assessment Tax Assessment Total Assessment is a certain percentage of the fair market value that is determined by local assessors to be the total taxable value of land and additions on the property. | Land | Improvement |
|---|---|---|---|---|
| 2025 | $9,512 | $770,200 | $280,500 | $489,700 |
| 2024 | $9,294 | $723,800 | $280,500 | $443,300 |
| 2023 | $8,706 | $645,400 | $255,200 | $390,200 |
| 2022 | $9,170 | $601,300 | $255,200 | $346,100 |
| 2021 | $9,155 | $560,600 | $232,100 | $328,500 |
| 2020 | $8,915 | $546,600 | $232,100 | $314,500 |
| 2019 | $8,996 | $527,000 | $232,100 | $294,900 |
| 2018 | $8,129 | $499,300 | $232,100 | $267,200 |
| 2017 | $7,837 | $474,400 | $215,900 | $258,500 |
| 2016 | $7,574 | $449,200 | $196,300 | $252,900 |
| 2015 | $7,255 | $449,200 | $196,300 | $252,900 |
Source: Public Records
Map
Nearby Homes
- 49 Washington Park Dr
- 18 Winterberry Ln
- 46 Brookwood Rd
- 535 Webster St
- 214 Washington St Unit 24
- 214 Washington St Unit 28
- 73 Shingle Mill Ln
- 5 Blueberry Ct
- 8 Blueberry Ct
- 7 Assinippi Ave Unit 205
- 7 Assinippi Ave Unit 306
- 18 Colby St
- 55 Turner Rd
- 776 Main St
- 44 Stone Meadow Ln
- 47 Stone Meadow Ln
- 36 Bayberry Ln
- 53 Chestnut St
- 17 Pine Haven Cir
- 225 Prospect St
Your Personal Tour Guide
Ask me questions while you tour the home.