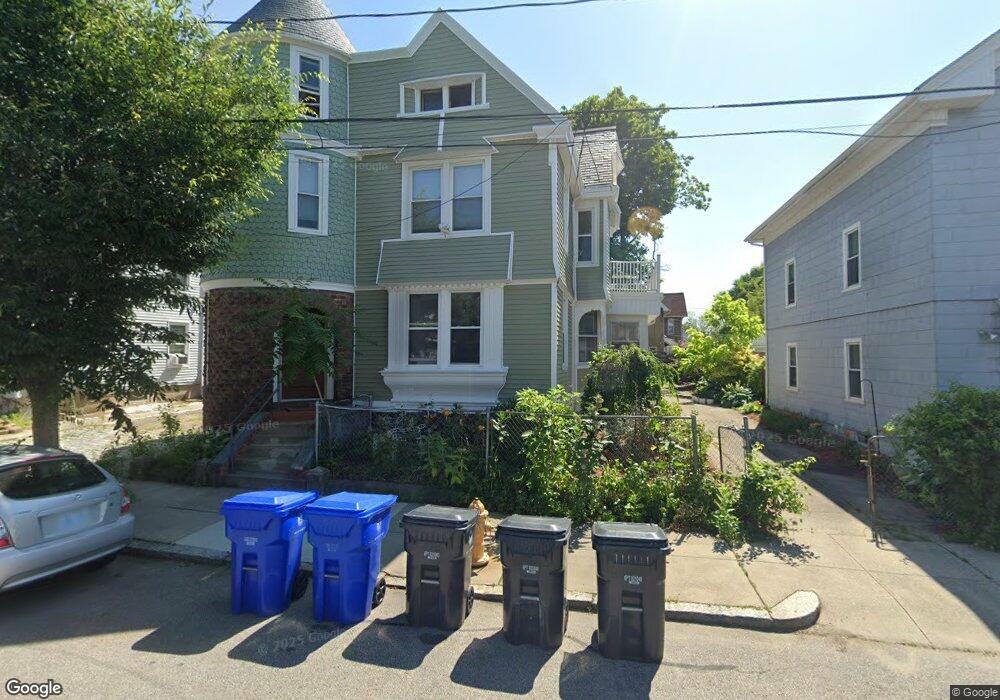
34 West Ave Pawtucket, RI 02860
Downtown Pawtucket NeighborhoodEstimated Value: $456,548 - $782,000
6
Beds
4
Baths
3,000
Sq Ft
$219/Sq Ft
Est. Value
About This Home
This home is located at 34 West Ave, Pawtucket, RI 02860 and is currently estimated at $655,637, approximately $218 per square foot. 34 West Ave is a home located in Providence County with nearby schools including International Charter School, Blackstone Academy Charter School, and Saint Raphael Academy.
Ownership History
Date
Name
Owned For
Owner Type
Purchase Details
Closed on
Oct 16, 2001
Sold by
Renaissance Inv Llc
Bought by
Hinds Ramon and Hind Frances
Current Estimated Value
Purchase Details
Closed on
Jun 9, 1999
Sold by
Kinch Christoper
Bought by
Flagstar Bank
Purchase Details
Closed on
Apr 14, 1998
Sold by
Hanlon Paul F
Bought by
Kinch Christopher
Purchase Details
Closed on
Apr 6, 1998
Sold by
Zarthar Robert S and Zarthar Anneliese
Bought by
Hanlon Paul F
Create a Home Valuation Report for This Property
The Home Valuation Report is an in-depth analysis detailing your home's value as well as a comparison with similar homes in the area
Home Values in the Area
Average Home Value in this Area
Purchase History
| Date | Buyer | Sale Price | Title Company |
|---|---|---|---|
| Hinds Ramon | $149,000 | -- | |
| Flagstar Bank | $58,000 | -- | |
| Kinch Christopher | $123,000 | -- | |
| Hanlon Paul F | $25,000 | -- |
Source: Public Records
Mortgage History
| Date | Status | Borrower | Loan Amount |
|---|---|---|---|
| Open | Hanlon Paul F | $265,000 | |
| Closed | Hanlon Paul F | $212,000 | |
| Closed | Hanlon Paul F | $146,895 |
Source: Public Records
Tax History
| Year | Tax Paid | Tax Assessment Tax Assessment Total Assessment is a certain percentage of the fair market value that is determined by local assessors to be the total taxable value of land and additions on the property. | Land | Improvement |
|---|---|---|---|---|
| 2025 | $7,064 | $537,200 | $72,800 | $464,400 |
| 2024 | $6,629 | $537,200 | $72,800 | $464,400 |
| 2023 | $6,905 | $407,600 | $40,500 | $367,100 |
| 2022 | $6,758 | $407,600 | $40,500 | $367,100 |
| 2021 | $6,758 | $407,600 | $40,500 | $367,100 |
| 2020 | $5,644 | $270,200 | $54,000 | $216,200 |
| 2019 | $5,644 | $270,200 | $54,000 | $216,200 |
| 2018 | $5,439 | $270,200 | $54,000 | $216,200 |
| 2017 | $5,487 | $241,500 | $52,700 | $188,800 |
| 2016 | $5,286 | $241,500 | $52,700 | $188,800 |
| 2015 | $5,286 | $241,500 | $52,700 | $188,800 |
| 2014 | $4,049 | $175,600 | $52,700 | $122,900 |
Source: Public Records
Map
Nearby Homes
Your Personal Tour Guide
Ask me questions while you tour the home.