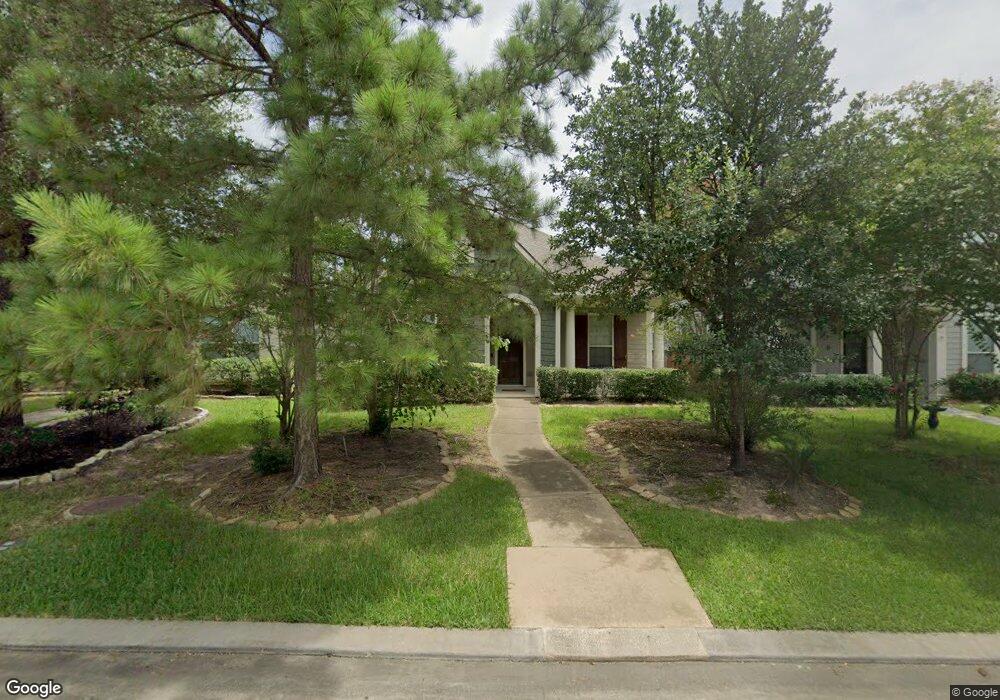
34 Whetstone Ridge Way Spring, TX 77382
Sterling Ridge NeighborhoodEstimated Value: $388,012 - $479,000
3
Beds
2
Baths
1,944
Sq Ft
$221/Sq Ft
Est. Value
About This Home
This home is located at 34 Whetstone Ridge Way, Spring, TX 77382 and is currently estimated at $429,753, approximately $221 per square foot. 34 Whetstone Ridge Way is a home located in Montgomery County with nearby schools including Deretchin Elementary School, McCullough Junior High School, and The Woodlands High School.
Ownership History
Date
Name
Owned For
Owner Type
Purchase Details
Closed on
Jul 31, 2017
Sold by
Bellard Karrie
Bought by
Flaherty Jennifer E
Current Estimated Value
Home Financials for this Owner
Home Financials are based on the most recent Mortgage that was taken out on this home.
Original Mortgage
$219,600
Outstanding Balance
$182,991
Interest Rate
3.91%
Mortgage Type
New Conventional
Estimated Equity
$246,762
Purchase Details
Closed on
Aug 8, 2008
Sold by
Weekley Homes Lp
Bought by
Bellard Karrie
Home Financials for this Owner
Home Financials are based on the most recent Mortgage that was taken out on this home.
Original Mortgage
$198,682
Interest Rate
6.47%
Mortgage Type
Purchase Money Mortgage
Purchase Details
Closed on
Dec 28, 2007
Sold by
The Woodlands Land Development Co Lp
Bought by
Weekley Homes Lp
Create a Home Valuation Report for This Property
The Home Valuation Report is an in-depth analysis detailing your home's value as well as a comparison with similar homes in the area
Home Values in the Area
Average Home Value in this Area
Purchase History
| Date | Buyer | Sale Price | Title Company |
|---|---|---|---|
| Flaherty Jennifer E | -- | Alamo Title Company | |
| Bellard Karrie | -- | Priority Title Co | |
| Weekley Homes Lp | -- | Priority Title Co |
Source: Public Records
Mortgage History
| Date | Status | Borrower | Loan Amount |
|---|---|---|---|
| Open | Flaherty Jennifer E | $219,600 | |
| Previous Owner | Bellard Karrie | $198,682 |
Source: Public Records
Tax History
| Year | Tax Paid | Tax Assessment Tax Assessment Total Assessment is a certain percentage of the fair market value that is determined by local assessors to be the total taxable value of land and additions on the property. | Land | Improvement |
|---|---|---|---|---|
| 2025 | $5,503 | $407,417 | $60,000 | $347,417 |
| 2024 | $4,968 | $389,752 | -- | -- |
| 2023 | $4,968 | $354,320 | $60,000 | $331,980 |
| 2022 | $6,509 | $322,110 | $60,000 | $292,290 |
| 2021 | $6,389 | $292,830 | $50,560 | $242,270 |
| 2020 | $6,152 | $270,060 | $50,560 | $219,500 |
| 2019 | $6,371 | $270,620 | $50,560 | $220,060 |
| 2018 | $6,160 | $261,680 | $50,560 | $211,120 |
| 2017 | $6,356 | $266,650 | $50,560 | $216,090 |
| 2016 | $6,454 | $270,790 | $50,560 | $220,590 |
| 2015 | $5,212 | $246,170 | $50,560 | $204,350 |
| 2014 | $5,212 | $223,790 | $50,560 | $173,230 |
Source: Public Records
Map
Nearby Homes
- 90 Panterra Way
- 66 Whetstone Ridge Way
- 73 E Montfair Blvd
- 137 E Montfair Blvd
- 15 Fillgrove Place
- 9011 Breckenridge Dr
- 7 Stickley Ct
- 83 Lakeside Green
- 51 Wickerdale Place
- 31 Wickerdale Place
- 6 Harmony Links Place
- 25042 Lindsey Ln
- 119 Benedict Canyon Loop
- 34 Pawprint Place
- 31503 Agassi Ct
- 34 Gilmore Grove Place
- 8702 Miller Rd
- 7403 Ponderosa Dr
- 11 Korbel Ct
- 133 E Frontera Cir
- 38 Whetstone Ridge Way
- 63 Whetstone Ridge Way
- 42 Whetstone Ridge Ct
- 90 W Montfair Blvd
- 67 Whetstone Ridge Way
- 94 W Montfair Blvd
- 71 Whetstone Ridge Way
- 46 Whetstone Ridge Ct
- 86 W Montfair Blvd
- 82 W Montfair Blvd
- 98 W Montfair Blvd
- 58 Whetstone Ridge Ct
- 102 W Montfair Blvd
- 75 Whetstone Ridge Way
- 98 Panterra Way
- 94 Panterra Way
- 50 Whetstone Ridge Ct
- 62 Whetstone Ridge Way
- 54 Whetstone Ridge Ct
- 106 W Montfair Blvd
Your Personal Tour Guide
Ask me questions while you tour the home.