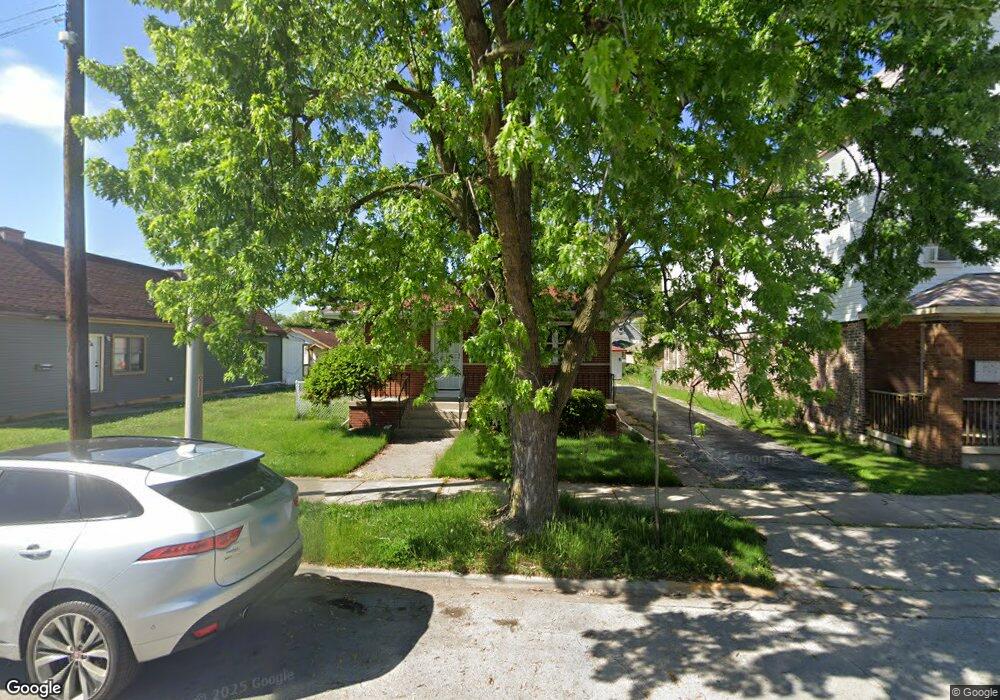
340 155th Place Calumet City, IL 60409
Estimated Value: $164,000 - $220,000
3
Beds
2
Baths
1,205
Sq Ft
$160/Sq Ft
Est. Value
About This Home
This home is located at 340 155th Place, Calumet City, IL 60409 and is currently estimated at $193,363, approximately $160 per square foot. 340 155th Place is a home located in Cook County with nearby schools including Lincoln Elementary School, Thornton Fractional North High School, and Hammond Academy Of Science & Tech.
Ownership History
Date
Name
Owned For
Owner Type
Purchase Details
Closed on
Mar 10, 2022
Sold by
Granite Nest Llc
Bought by
Commercial Acquistions Llc
Current Estimated Value
Purchase Details
Closed on
Feb 28, 2022
Sold by
Granite Nest Llc
Bought by
Commercial Acquistions Llc
Purchase Details
Closed on
Jan 10, 2020
Sold by
Bgh Sfr Btr Fund I Llc
Bought by
Granite Nest Llc
Purchase Details
Closed on
Nov 8, 2018
Sold by
Eon Fund 13 Llc
Bought by
Bgh Sfr Btr Fund I Llc
Purchase Details
Closed on
Mar 27, 2018
Sold by
Fannie Mae
Bought by
Eon Fund 13 Llc
Create a Home Valuation Report for This Property
The Home Valuation Report is an in-depth analysis detailing your home's value as well as a comparison with similar homes in the area
Home Values in the Area
Average Home Value in this Area
Purchase History
| Date | Buyer | Sale Price | Title Company |
|---|---|---|---|
| Commercial Acquistions Llc | $165,500 | -- | |
| Commercial Acquistions Llc | $165,500 | -- | |
| Granite Nest Llc | -- | None Available | |
| Bgh Sfr Btr Fund I Llc | -- | None Available | |
| Eon Fund 13 Llc | -- | First American Title |
Source: Public Records
Tax History Compared to Growth
Tax History
| Year | Tax Paid | Tax Assessment Tax Assessment Total Assessment is a certain percentage of the fair market value that is determined by local assessors to be the total taxable value of land and additions on the property. | Land | Improvement |
|---|---|---|---|---|
| 2024 | $6,084 | $11,000 | $3,674 | $7,326 |
| 2023 | $6,583 | $11,000 | $3,674 | $7,326 |
| 2022 | $6,583 | $9,094 | $3,215 | $5,879 |
| 2021 | $6,718 | $9,093 | $3,214 | $5,879 |
| 2020 | $6,264 | $9,093 | $3,214 | $5,879 |
| 2019 | $6,828 | $9,443 | $2,985 | $6,458 |
| 2018 | $6,729 | $9,443 | $2,985 | $6,458 |
| 2017 | $6,484 | $9,443 | $2,985 | $6,458 |
| 2016 | $6,600 | $10,206 | $2,755 | $7,451 |
| 2015 | $6,370 | $10,206 | $2,755 | $7,451 |
| 2014 | $6,365 | $10,206 | $2,755 | $7,451 |
| 2013 | $5,774 | $10,194 | $2,755 | $7,439 |
Source: Public Records
Map
Nearby Homes