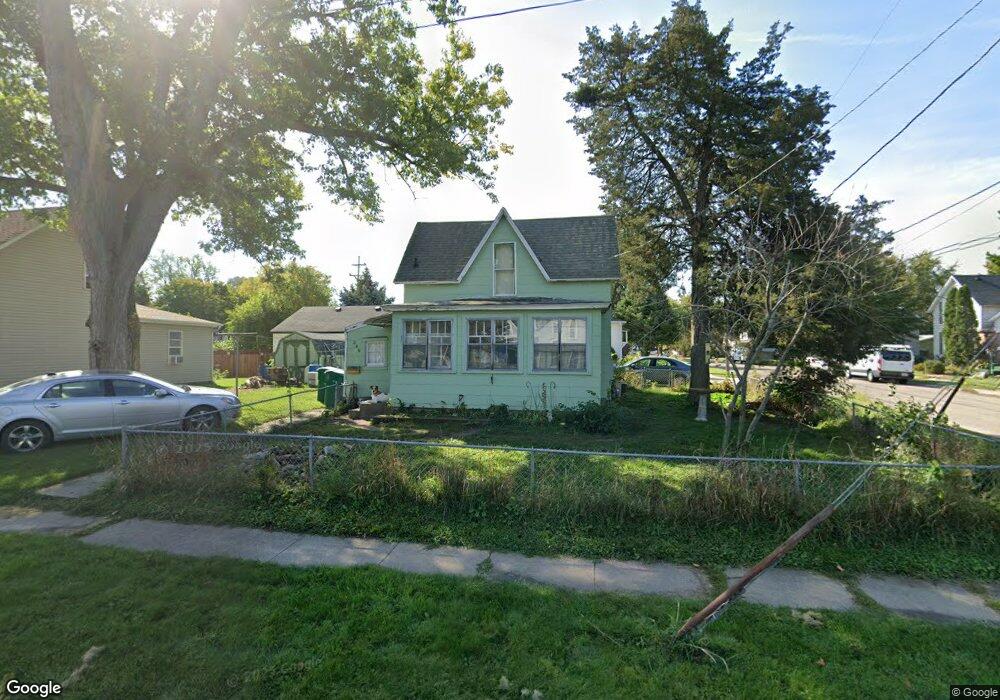
340 Charles St Sycamore, IL 60178
Estimated Value: $122,647 - $203,000
Studio
--
Bath
557
Sq Ft
$304/Sq Ft
Est. Value
About This Home
This home is located at 340 Charles St, Sycamore, IL 60178 and is currently estimated at $169,162, approximately $303 per square foot. 340 Charles St is a home located in DeKalb County with nearby schools including Sycamore High School, St Mary's Catholic School, and Cornerstone Christian Academy.
Ownership History
Date
Name
Owned For
Owner Type
Purchase Details
Closed on
Nov 10, 2017
Sold by
Maness Shirley A
Bought by
Maness Shirley A and Shirley A Maness Declaration Of Trust No
Current Estimated Value
Create a Home Valuation Report for This Property
The Home Valuation Report is an in-depth analysis detailing your home's value as well as a comparison with similar homes in the area
Home Values in the Area
Average Home Value in this Area
Purchase History
| Date | Buyer | Sale Price | Title Company |
|---|---|---|---|
| Maness Shirley A | -- | None Available |
Source: Public Records
Tax History
| Year | Tax Paid | Tax Assessment Tax Assessment Total Assessment is a certain percentage of the fair market value that is determined by local assessors to be the total taxable value of land and additions on the property. | Land | Improvement |
|---|---|---|---|---|
| 2024 | $887 | $36,058 | $11,242 | $24,816 |
| 2023 | $930 | $32,927 | $10,266 | $22,661 |
| 2022 | $930 | $30,200 | $9,416 | $20,784 |
| 2021 | $946 | $28,352 | $8,840 | $19,512 |
| 2020 | $958 | $27,655 | $8,623 | $19,032 |
| 2019 | $965 | $27,049 | $8,434 | $18,615 |
| 2018 | $981 | $26,228 | $8,178 | $18,050 |
| 2017 | $999 | $25,190 | $7,854 | $17,336 |
| 2016 | $1,025 | $24,041 | $7,496 | $16,545 |
| 2015 | -- | $22,627 | $7,055 | $15,572 |
| 2014 | -- | $21,486 | $6,699 | $14,787 |
| 2013 | -- | $21,897 | $6,827 | $15,070 |
Source: Public Records
Map
Nearby Homes
- 732 Park Ave
- 906 Somonauk St
- 405 W High St
- 835 Albert Ave
- 533 W State St
- 962 Bailey Rd
- Lot 1 Route 23
- 401 E Lincoln St
- 206 Becker Place
- 215 Becker Place
- 216 Becker Place
- 914 Nottingham Rd
- 922 Nottingham Rd
- 429 Fairway Ln
- 356 Home St
- 418 Fairway Ln
- 1024 Nottingham Rd
- 1008 Nottingham Rd
- 1032 Nottingham Rd
- 432 Fairway Ln
Your Personal Tour Guide
Ask me questions while you tour the home.