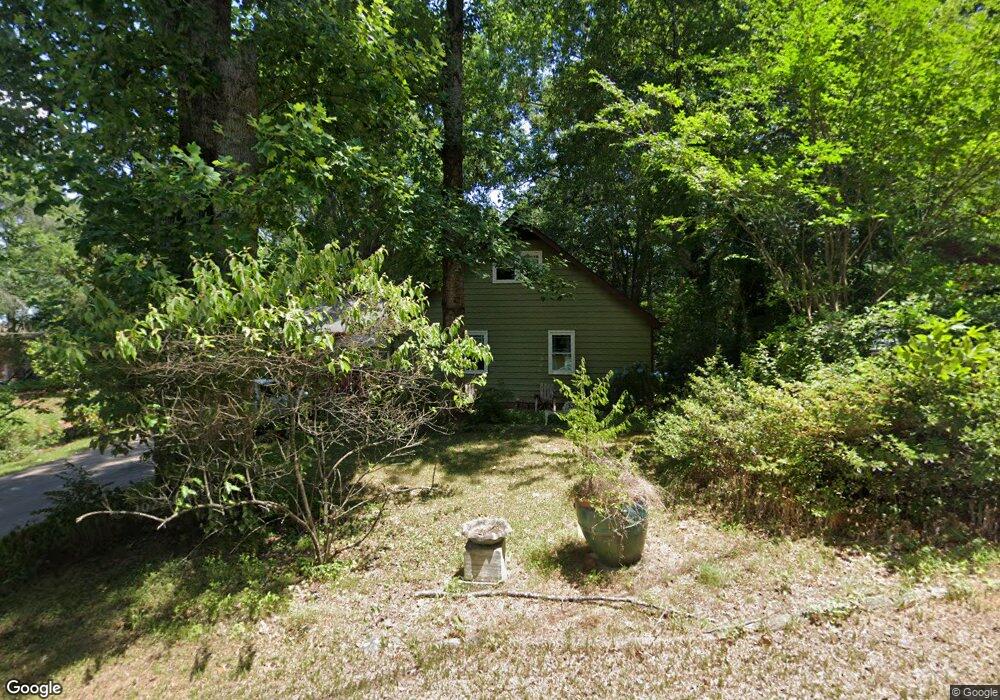
340 Cherokee St Canton, GA 30114
Historic Canton NeighborhoodEstimated Value: $421,000 - $471,000
5
Beds
3
Baths
2,610
Sq Ft
$171/Sq Ft
Est. Value
About This Home
This home is located at 340 Cherokee St, Canton, GA 30114 and is currently estimated at $447,019, approximately $171 per square foot. 340 Cherokee St is a home located in Cherokee County with nearby schools including Hasty Elementary School Fine Arts Academy, Teasley Middle School, and Cherokee High School.
Ownership History
Date
Name
Owned For
Owner Type
Purchase Details
Closed on
Nov 8, 2024
Sold by
Martin William J
Bought by
Martin Kelly and Martin William Joseph
Current Estimated Value
Home Financials for this Owner
Home Financials are based on the most recent Mortgage that was taken out on this home.
Original Mortgage
$105,500
Outstanding Balance
$104,489
Interest Rate
6.32%
Mortgage Type
New Conventional
Estimated Equity
$342,530
Purchase Details
Closed on
Jun 20, 2017
Sold by
Martin Christine R
Bought by
Martin William J
Home Financials for this Owner
Home Financials are based on the most recent Mortgage that was taken out on this home.
Original Mortgage
$197,600
Interest Rate
4.02%
Mortgage Type
New Conventional
Purchase Details
Closed on
May 27, 2005
Sold by
Bernhardt Gary G and Bernhardt Suzanne
Bought by
Martin William J and Martin Christine
Home Financials for this Owner
Home Financials are based on the most recent Mortgage that was taken out on this home.
Original Mortgage
$193,687
Interest Rate
5.74%
Mortgage Type
VA
Create a Home Valuation Report for This Property
The Home Valuation Report is an in-depth analysis detailing your home's value as well as a comparison with similar homes in the area
Home Values in the Area
Average Home Value in this Area
Purchase History
| Date | Buyer | Sale Price | Title Company |
|---|---|---|---|
| Martin Kelly | -- | -- | |
| Martin William J | -- | -- | |
| Martin William J | $187,500 | -- |
Source: Public Records
Mortgage History
| Date | Status | Borrower | Loan Amount |
|---|---|---|---|
| Open | Martin Kelly | $105,500 | |
| Previous Owner | Martin William J | $197,600 | |
| Previous Owner | Martin William J | $193,687 |
Source: Public Records
Tax History Compared to Growth
Tax History
| Year | Tax Paid | Tax Assessment Tax Assessment Total Assessment is a certain percentage of the fair market value that is determined by local assessors to be the total taxable value of land and additions on the property. | Land | Improvement |
|---|---|---|---|---|
| 2024 | $3,616 | $139,476 | $17,600 | $121,876 |
| 2023 | $3,616 | $139,476 | $17,600 | $121,876 |
| 2022 | $3,051 | $115,316 | $17,600 | $97,716 |
| 2021 | $2,603 | $89,916 | $13,200 | $76,716 |
| 2020 | $2,456 | $84,036 | $13,200 | $70,836 |
| 2019 | $2,436 | $83,160 | $13,200 | $69,960 |
| 2018 | $2,264 | $75,920 | $9,880 | $66,040 |
| 2017 | $2,258 | $187,900 | $9,880 | $65,280 |
| 2016 | $1,742 | $175,700 | $9,880 | $60,400 |
| 2015 | $1,598 | $160,400 | $9,880 | $54,280 |
| 2014 | $1,757 | $141,600 | $9,880 | $46,760 |
Source: Public Records
Map
Nearby Homes
- 210 Tanyard St
- 950 E Main St
- 235 W Marietta St
- 176 Railroad St
- 172 Railroad St
- 120 E Killian St
- 231 Breeze Hill Ln
- 23 Riverdale Cir
- 241 E Killian St
- 251 E Killian St
- 42 Riverdale Cir
- 357 Breeze Hill Ln
- 0 Reed St Unit 7646438
- 131 Riverwatch Ct
- 727 Lower Scott Mill Rd
- 0 Lake St Unit 10599928
- 0 Lake St Unit 7637074
- 3789 Cherokee Overlook Dr
- 350 Cherokee St
- 0 Cherokee St Unit 7354530
- 0 Cherokee St Unit 7325597
- 0 Cherokee St Unit 7091350
- 0 Cherokee St Unit 8871661
- 0 Cherokee St Unit 8239535
- 0 Cherokee St Unit 7208084
- 0 Cherokee St Unit 8631478
- 0 Cherokee St Unit 3197786
- 0 Cherokee St
- 330 Cherokee St
- 306 Cherokee St Unit 1203
- 339 Cherokee St
- 360 Cherokee St
- 335 Cherokee St
- 351 Cherokee St
- 327 Cherokee St
- 331 Cherokee St
- 370 Cherokee St
- 102 Oleander Way