Estimated Value: $811,000 - $935,000
4
Beds
3
Baths
2,505
Sq Ft
$352/Sq Ft
Est. Value
About This Home
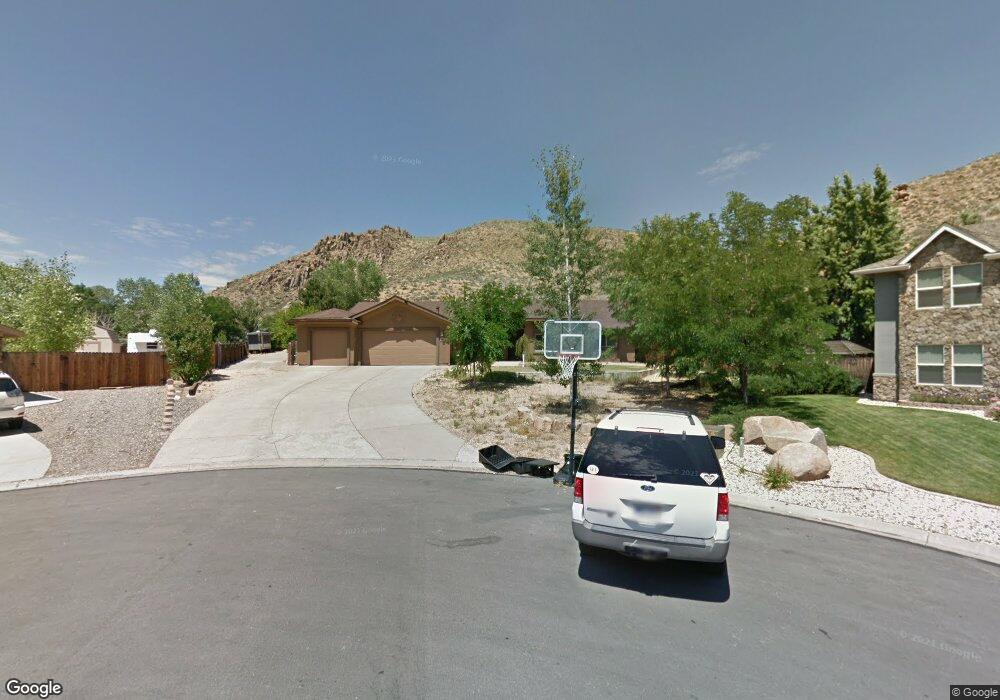
This home is located at 340 Cliff View Ct, Reno, NV 89523 and is currently estimated at $881,808, approximately $352 per square foot. 340 Cliff View Ct is a home located in Washoe County with nearby schools including Verdi Elementary School, B D Billinghurst Middle School, and Robert McQueen High School.
Ownership History
Date
Name
Owned For
Owner Type
Purchase Details
Closed on
Sep 18, 2018
Sold by
Eckroth Jeffrey M
Bought by
Eckroth Jeffrey Michael and The Jm Eckroth Trust
Current Estimated Value
Purchase Details
Closed on
Dec 20, 2010
Sold by
Eckroth Jeffrey M and Eckroth Jeff M
Bought by
Eckroth Jeffrey M
Home Financials for this Owner
Home Financials are based on the most recent Mortgage that was taken out on this home.
Original Mortgage
$280,000
Interest Rate
4.17%
Mortgage Type
New Conventional
Purchase Details
Closed on
Jul 2, 2001
Sold by
Eckroth Jennifer
Bought by
Eckroth Jeff M
Home Financials for this Owner
Home Financials are based on the most recent Mortgage that was taken out on this home.
Original Mortgage
$193,200
Interest Rate
7.14%
Create a Home Valuation Report for This Property
The Home Valuation Report is an in-depth analysis detailing your home's value as well as a comparison with similar homes in the area
Home Values in the Area
Average Home Value in this Area
Purchase History
| Date | Buyer | Sale Price | Title Company |
|---|---|---|---|
| Eckroth Jeffrey Michael | -- | None Available | |
| Eckroth Jeffrey M | -- | Western Title Company | |
| Eckroth Jeff M | -- | Western Title Inc | |
| Eckroth Jeffrey M | $241,500 | Western Title Inc |
Source: Public Records
Mortgage History
| Date | Status | Borrower | Loan Amount |
|---|---|---|---|
| Previous Owner | Eckroth Jeffrey M | $280,000 | |
| Previous Owner | Eckroth Jeffrey M | $193,200 |
Source: Public Records
Tax History Compared to Growth
Tax History
| Year | Tax Paid | Tax Assessment Tax Assessment Total Assessment is a certain percentage of the fair market value that is determined by local assessors to be the total taxable value of land and additions on the property. | Land | Improvement |
|---|---|---|---|---|
| 2025 | $3,148 | $136,402 | $62,524 | $73,878 |
| 2024 | $3,058 | $138,783 | $59,675 | $79,108 |
| 2023 | $2,216 | $132,314 | $57,943 | $74,371 |
| 2022 | $2,969 | $109,467 | $47,394 | $62,074 |
| 2021 | $2,885 | $98,251 | $35,497 | $62,754 |
| 2020 | $2,799 | $96,764 | $33,075 | $63,689 |
| 2019 | $2,718 | $92,555 | $30,503 | $62,052 |
| 2018 | $2,636 | $85,742 | $24,623 | $61,119 |
| 2017 | $2,562 | $80,056 | $18,302 | $61,754 |
| 2016 | $2,498 | $80,159 | $17,750 | $62,409 |
| 2015 | $2,494 | $78,720 | $15,950 | $62,770 |
| 2014 | $2,420 | $77,318 | $16,317 | $61,001 |
| 2013 | -- | $72,018 | $11,585 | $60,433 |
Source: Public Records
Map
Nearby Homes
- 285 Lemming Dr
- 1065 Udowski Unit Homesite 52
- 1080 Udowski Unit Homesite 62
- 480 Gooseberry Dr
- 1045 Udowski Ct Unit Homesite 54
- 1522 River Hill Way Unit Homesite 48
- 00 Painted River Trail
- 1569 River Hill Way
- 1593 River Hill Way
- 20 Eagle Claw Ct
- Plan 6 at Brae Retreat
- Plan 8 at Brae Retreat
- Plan 7 at Brae Retreat
- Plan 3 at Brae Retreat
- 7680 Stone Bluff Way
- 7693 Stone Bluff Way
- 150 Mule Deer Dr
- 7867 Morgan Pointe Cir
- 1800 Laurel Ridge Dr
- 1825 Stone Pointe Dr
- 345 Cliff View Ct
- 330 Cliff View Ct
- 320 Cliff View Ct Unit 1
- 335 Cliff View Ct
- 335 Cliff View Dr
- 315 Cliff View Dr
- 295 Cliff View Dr
- 300 Cliff View Ct
- 345 Cliff View Dr
- 325 Cliff View Ct
- 285 Cliff View Dr
- 280 Cliff View Ct
- 375 Cliff View Dr
- 315 Cliff View Ct
- 265 Cliff View Dr
- 320 Cliff View Dr
- 300 Cliff View Dr Unit 1
- 10065 Raccoon Ct
- 385 Cliff View Dr
- 285 Cliff View Ct