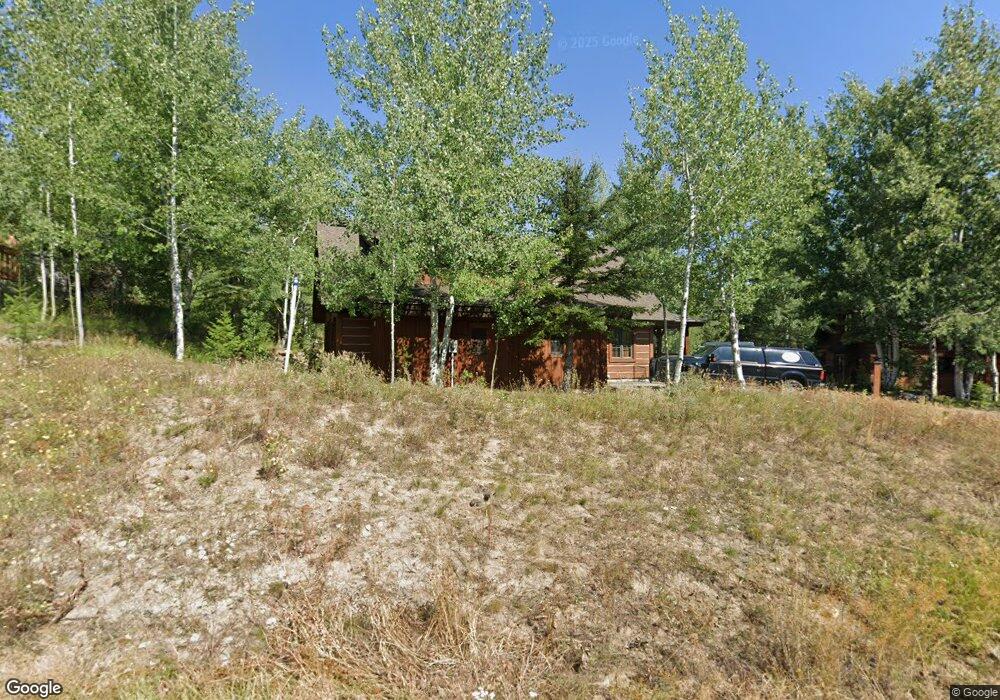
340 Discovery Dr Cascade, ID 83611
Estimated Value: $1,600,000 - $1,955,000
3
Beds
2
Baths
1,846
Sq Ft
$920/Sq Ft
Est. Value
About This Home
This home is located at 340 Discovery Dr, Cascade, ID 83611 and is currently estimated at $1,699,176, approximately $920 per square foot. 340 Discovery Dr is a home with nearby schools including Donnelly Elementary School and McCall-Donnelly High School.
Ownership History
Date
Name
Owned For
Owner Type
Purchase Details
Closed on
Oct 6, 2020
Sold by
Broken Horn Development Llc
Bought by
Abert Melvyn and Abert Connie C
Current Estimated Value
Purchase Details
Closed on
Jan 10, 2020
Sold by
Hawks Rulin J
Bought by
Broken Horn Development Llc
Purchase Details
Closed on
Oct 27, 2015
Sold by
Bloxsom Belinda Obst
Bought by
Hawks Rulin J
Home Financials for this Owner
Home Financials are based on the most recent Mortgage that was taken out on this home.
Original Mortgage
$445,500
Interest Rate
3.87%
Mortgage Type
New Conventional
Purchase Details
Closed on
Sep 4, 2013
Sold by
S4 Partners Llc
Bought by
Blossom Belinda Obst
Purchase Details
Closed on
Jun 28, 2004
Sold by
Tamarack Resort Llc
Bought by
S4 Partners Llc
Home Financials for this Owner
Home Financials are based on the most recent Mortgage that was taken out on this home.
Original Mortgage
$380,240
Interest Rate
4.75%
Mortgage Type
Adjustable Rate Mortgage/ARM
Create a Home Valuation Report for This Property
The Home Valuation Report is an in-depth analysis detailing your home's value as well as a comparison with similar homes in the area
Home Values in the Area
Average Home Value in this Area
Purchase History
| Date | Buyer | Sale Price | Title Company |
|---|---|---|---|
| Abert Melvyn | -- | Amerititle Cascade | |
| Broken Horn Development Llc | -- | Amerititle Cascade | |
| Hawks Rulin J | -- | Amerititle Cascade | |
| Blossom Belinda Obst | -- | Amerititle | |
| S4 Partners Llc | -- | -- |
Source: Public Records
Mortgage History
| Date | Status | Borrower | Loan Amount |
|---|---|---|---|
| Previous Owner | Hawks Rulin J | $445,500 | |
| Previous Owner | S4 Partners Llc | $380,240 |
Source: Public Records
Tax History Compared to Growth
Tax History
| Year | Tax Paid | Tax Assessment Tax Assessment Total Assessment is a certain percentage of the fair market value that is determined by local assessors to be the total taxable value of land and additions on the property. | Land | Improvement |
|---|---|---|---|---|
| 2025 | $4,489 | $1,593,980 | $450,000 | $1,143,980 |
| 2023 | $4,489 | $1,459,358 | $420,000 | $1,039,358 |
| 2022 | $3,706 | $1,157,848 | $405,000 | $752,848 |
| 2021 | $4,030 | $808,693 | $175,000 | $633,693 |
| 2020 | $3,518 | $591,136 | $150,000 | $441,136 |
| 2019 | $3,238 | $486,988 | $105,000 | $381,988 |
| 2018 | $3,016 | $429,019 | $93,000 | $336,019 |
| 2017 | $3,009 | $406,771 | $93,000 | $313,771 |
| 2016 | $3,181 | $427,317 | $97,250 | $330,067 |
| 2015 | $3,107 | $398,193 | $0 | $0 |
| 2013 | -- | $381,920 | $0 | $0 |
Source: Public Records
Map
Nearby Homes
- 77 Tripod Ct Unit 53
- 77 Tripod Ct
- 201 Discovery Dr Unit 31A
- 190 Pinnacle Place
- 190 Pinnacle Place Unit 29
- 94 Discovery Dr Unit 3
- 100 Discovery Dr Unit 3
- 994 Discovery Dr
- 90 Discovery Dr Unit 1
- 459 Discovery Dr
- 131 Twin Creek Ct
- 495 Discovery Dr
- 114 Twin Creek Ct
- 151 Pinnacle Ct Unit 47
- 151 Pinnacle Ct
- 150 Pinnacle Ct
- 150 Pinnacle Ct Unit 28
- 590 Discovery Dr Unit 75
- 590 Discovery Dr
- 9 Rock Creek Ct
- 342 Discovery Dr
- 339 Discovery Dr
- 339 Discovery Dr Unit 16
- 339 Discovery Dr Unit 61
- 256 Discovery Dr
- 258 Discovery Dr
- 256 Discovery Dr
- 372 Discovery Dr
- 371 Discovery Dr
- 254 Discovery Dr
- 371 Discovery Dr
- 254 Discovery Dr
- 260 Discovery
- 339 Discovery Dr
- 374 Discovery Dr
- 260 Discovery Dr
- 252 Discovery
- 69 Pinnacle Ct Unit 46A
- Lot 46A Pinnacle Ct Unit 46A
- LT 36 Pinnacle Ct Unit 36