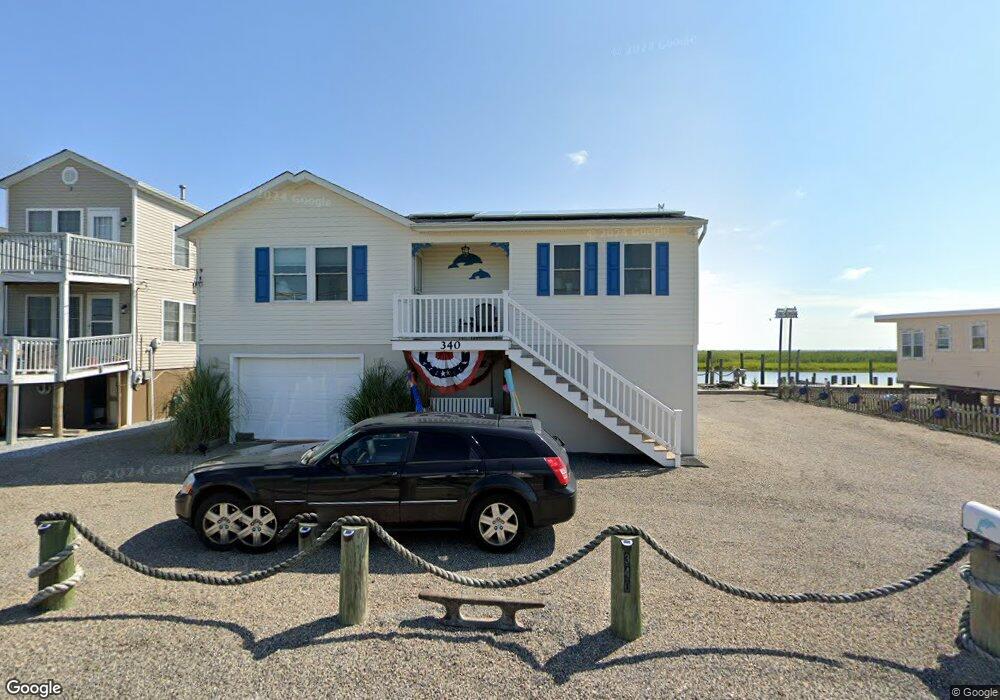
340 Dock Rd West Creek, NJ 08092
Eaglewood NeighborhoodEstimated Value: $470,104 - $691,000
2
Beds
1
Bath
1,024
Sq Ft
$539/Sq Ft
Est. Value
About This Home
This home is located at 340 Dock Rd, West Creek, NJ 08092 and is currently estimated at $552,026, approximately $539 per square foot. 340 Dock Rd is a home located in Ocean County with nearby schools including Eagleswood Elementary School, Pinelands Regional Junior High School, and Pinelands Regional High School.
Ownership History
Date
Name
Owned For
Owner Type
Purchase Details
Closed on
Dec 22, 2017
Sold by
Manna Scott F and Manna Julie
Bought by
Odonnell Michael J and Odonnell Louise C
Current Estimated Value
Home Financials for this Owner
Home Financials are based on the most recent Mortgage that was taken out on this home.
Original Mortgage
$248,000
Outstanding Balance
$137,974
Interest Rate
3.92%
Mortgage Type
New Conventional
Estimated Equity
$414,052
Purchase Details
Closed on
Mar 31, 2004
Sold by
Hoffman Marie E Didio
Bought by
Manna Scott and Manna Julie
Home Financials for this Owner
Home Financials are based on the most recent Mortgage that was taken out on this home.
Original Mortgage
$200,000
Interest Rate
5.47%
Mortgage Type
Purchase Money Mortgage
Purchase Details
Closed on
Jun 13, 1997
Sold by
Hollingsworth Thomas
Bought by
Hoffman Marie Didio
Create a Home Valuation Report for This Property
The Home Valuation Report is an in-depth analysis detailing your home's value as well as a comparison with similar homes in the area
Home Values in the Area
Average Home Value in this Area
Purchase History
| Date | Buyer | Sale Price | Title Company |
|---|---|---|---|
| Odonnell Michael J | $312,500 | American Land Title | |
| Manna Scott | $300,000 | Southern Shores Title Agency | |
| Hoffman Marie Didio | $125,000 | -- |
Source: Public Records
Mortgage History
| Date | Status | Borrower | Loan Amount |
|---|---|---|---|
| Open | Odonnell Michael J | $248,000 | |
| Previous Owner | Manna Scott | $200,000 | |
| Closed | Manna Scott | $60,000 |
Source: Public Records
Tax History Compared to Growth
Tax History
| Year | Tax Paid | Tax Assessment Tax Assessment Total Assessment is a certain percentage of the fair market value that is determined by local assessors to be the total taxable value of land and additions on the property. | Land | Improvement |
|---|---|---|---|---|
| 2025 | $7,472 | $271,400 | $163,800 | $107,600 |
| 2024 | $7,442 | $271,400 | $163,800 | $107,600 |
| 2023 | $7,255 | $271,400 | $163,800 | $107,600 |
| 2022 | $7,255 | $271,400 | $163,800 | $107,600 |
| 2021 | $7,217 | $271,400 | $163,800 | $107,600 |
| 2020 | $7,360 | $271,400 | $163,800 | $107,600 |
| 2019 | $7,138 | $271,400 | $163,800 | $107,600 |
| 2018 | $6,657 | $271,400 | $163,800 | $107,600 |
| 2017 | $6,641 | $271,400 | $163,800 | $107,600 |
| 2016 | $6,421 | $271,400 | $163,800 | $107,600 |
| 2015 | $6,169 | $271,400 | $163,800 | $107,600 |
| 2014 | $5,965 | $271,400 | $163,800 | $107,600 |
Source: Public Records
Map
Nearby Homes
- 322 Dock Rd
- 375 Dock Rd
- 202 S Creek Dr
- 434 Dock Rd
- 198 John St
- 6 Juniper Place
- 135 Juniper Dr
- 110 Juniper Dr
- 896 U S 9
- 108 Juniper Dr
- 11 Persimmon Dr
- 0 Stone Rd Unit 22508801
- 11 Travis Way
- 77 Seameadow Dr
- 126 Bartlett Ave
- 45 Sea Breeze Dr
- 687 Route 9
- 215 Parkertown Dr
- 132 Chestnut St
- 6 Eagle Ridge Ln