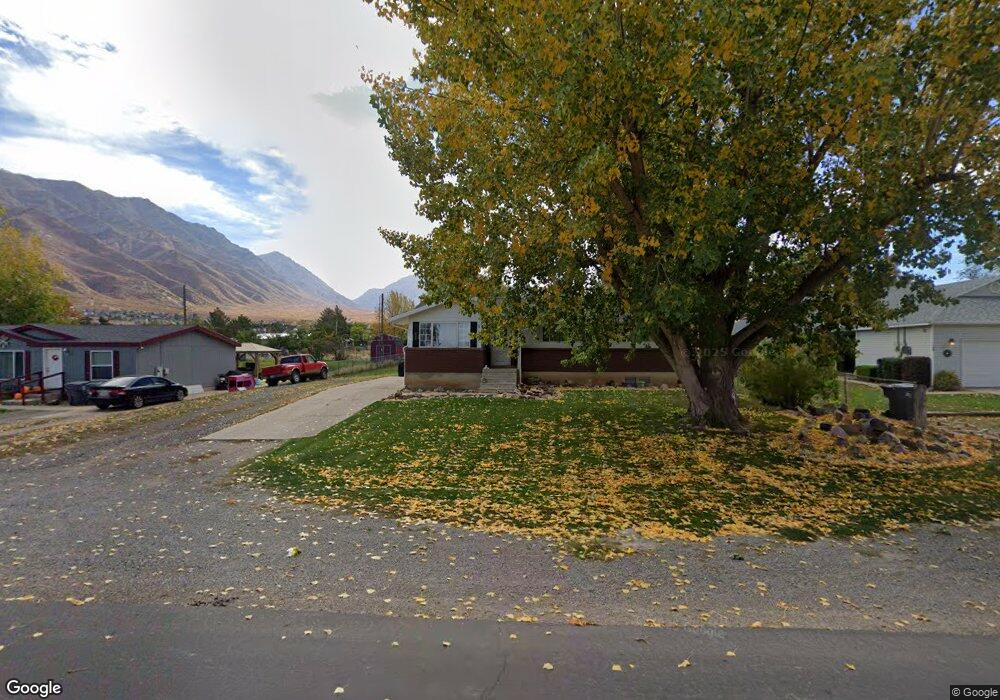
340 E 400 N Santaquin, UT 84655
Estimated Value: $420,000 - $426,000
3
Beds
2
Baths
1,216
Sq Ft
$348/Sq Ft
Est. Value
About This Home
This home is located at 340 E 400 N, Santaquin, UT 84655 and is currently estimated at $422,592, approximately $347 per square foot. 340 E 400 N is a home located in Utah County with nearby schools including Apple Valley Elementary, Payson Junior High School, and Mt. Nebo Middle.
Ownership History
Date
Name
Owned For
Owner Type
Purchase Details
Closed on
Jun 27, 1997
Sold by
Bryson Patrick A and Bryson Debbie A
Bought by
Christensen Kent W and Christensen Karen
Current Estimated Value
Home Financials for this Owner
Home Financials are based on the most recent Mortgage that was taken out on this home.
Original Mortgage
$109,360
Outstanding Balance
$16,243
Interest Rate
7.91%
Mortgage Type
FHA
Estimated Equity
$406,349
Purchase Details
Closed on
Feb 14, 1997
Sold by
Bryson Patrick A and Bryson Debra A
Bought by
Bryson Patrick A and Bryson Debbie A
Home Financials for this Owner
Home Financials are based on the most recent Mortgage that was taken out on this home.
Original Mortgage
$82,700
Interest Rate
7.85%
Create a Home Valuation Report for This Property
The Home Valuation Report is an in-depth analysis detailing your home's value as well as a comparison with similar homes in the area
Home Values in the Area
Average Home Value in this Area
Purchase History
| Date | Buyer | Sale Price | Title Company |
|---|---|---|---|
| Christensen Kent W | -- | -- | |
| Bryson Patrick A | -- | -- |
Source: Public Records
Mortgage History
| Date | Status | Borrower | Loan Amount |
|---|---|---|---|
| Open | Christensen Kent W | $109,360 | |
| Previous Owner | Bryson Patrick A | $82,700 |
Source: Public Records
Tax History
| Year | Tax Paid | Tax Assessment Tax Assessment Total Assessment is a certain percentage of the fair market value that is determined by local assessors to be the total taxable value of land and additions on the property. | Land | Improvement |
|---|---|---|---|---|
| 2025 | $2,026 | $227,810 | -- | -- |
| 2024 | $2,026 | $201,740 | $0 | $0 |
| 2023 | $2,082 | $207,955 | $0 | $0 |
| 2022 | $2,207 | $227,425 | $0 | $0 |
| 2021 | $1,883 | $300,700 | $80,000 | $220,700 |
| 2020 | $1,801 | $278,800 | $69,600 | $209,200 |
| 2019 | $1,590 | $251,700 | $65,700 | $186,000 |
| 2018 | $1,481 | $223,500 | $61,800 | $161,700 |
| 2017 | $1,426 | $115,005 | $0 | $0 |
| 2016 | $1,348 | $106,535 | $0 | $0 |
| 2015 | $1,227 | $95,095 | $0 | $0 |
| 2014 | $1,106 | $85,525 | $0 | $0 |
Source: Public Records
Map
Nearby Homes
- 136 N 200 E
- 42 E 400 N
- 600 N Center St
- 341 E 100 S
- 49 S 100 E
- 152 E 840 N Unit 16
- 873 N 200 E Unit 36
- 842 N 160 E
- 842 N 160 E Unit 17
- 41 W 770 N
- 169 W 690 N
- 902 N 160 E
- 902 N 160 E Unit 19
- 225 W 500 North St
- 923 N 200 E Unit 33
- 933 N 200 E
- 933 N 200 E Unit 32
- 112 W 770 N
- 78 N Peach St
- 202 N Oh Henry St
Your Personal Tour Guide
Ask me questions while you tour the home.