Estimated Value: $293,000 - $320,000
Studio
--
Bath
1,099
Sq Ft
$281/Sq Ft
Est. Value
About This Home
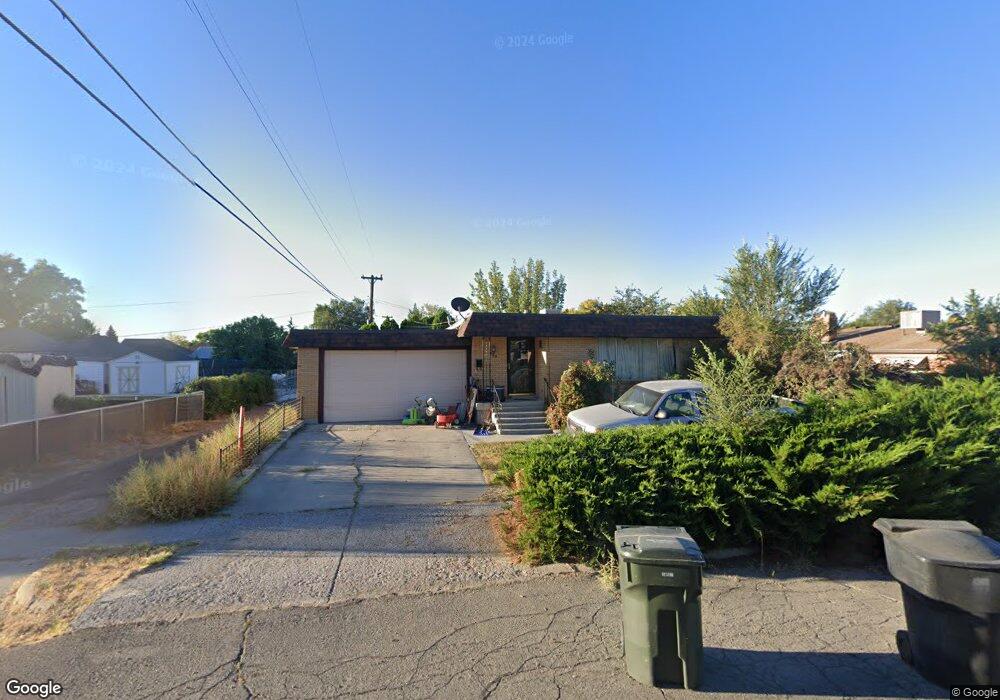
This home is located at 340 E 700 N, Price, UT 84501 and is currently estimated at $308,281, approximately $280 per square foot. 340 E 700 N is a home located in Carbon County with nearby schools including Castle Heights School, Mont Harmon Junior High School, and Carbon High School.
Ownership History
Date
Name
Owned For
Owner Type
Purchase Details
Closed on
Sep 15, 2020
Sold by
Gallucci Carlo Jay
Bought by
Manzanares Ronald R
Current Estimated Value
Home Financials for this Owner
Home Financials are based on the most recent Mortgage that was taken out on this home.
Original Mortgage
$189,504
Outstanding Balance
$167,473
Interest Rate
2.8%
Mortgage Type
FHA
Estimated Equity
$140,808
Purchase Details
Closed on
Jul 16, 2018
Sold by
Holloran Kylie O
Bought by
Gallucci Carlo Jay
Home Financials for this Owner
Home Financials are based on the most recent Mortgage that was taken out on this home.
Original Mortgage
$163,214
Interest Rate
4.5%
Mortgage Type
VA
Purchase Details
Closed on
Nov 28, 2016
Sold by
Murdock Sharon
Bought by
Kylie Murdock Sharon and Halloran Kylie O
Create a Home Valuation Report for This Property
The Home Valuation Report is an in-depth analysis detailing your home's value as well as a comparison with similar homes in the area
Purchase History
| Date | Buyer | Sale Price | Title Company |
|---|---|---|---|
| Manzanares Ronald R | -- | South Eastern Utah Ttl Compa | |
| Gallucci Carlo Jay | -- | Professional Title Services | |
| Kylie Murdock Sharon | -- | -- |
Source: Public Records
Mortgage History
| Date | Status | Borrower | Loan Amount |
|---|---|---|---|
| Open | Manzanares Ronald R | $189,504 | |
| Previous Owner | Gallucci Carlo Jay | $163,214 |
Source: Public Records
Tax History
| Year | Tax Paid | Tax Assessment Tax Assessment Total Assessment is a certain percentage of the fair market value that is determined by local assessors to be the total taxable value of land and additions on the property. | Land | Improvement |
|---|---|---|---|---|
| 2025 | $1,957 | $161,106 | $8,863 | $152,243 |
| 2024 | $1,506 | $125,354 | $9,900 | $115,454 |
| 2023 | $1,837 | $163,106 | $12,140 | $150,966 |
| 2022 | $1,838 | $146,369 | $10,094 | $136,275 |
| 2021 | $1,577 | $194,968 | $15,422 | $179,546 |
| 2020 | $1,546 | $95,933 | $0 | $0 |
| 2019 | $1,374 | $89,413 | $0 | $0 |
| 2018 | $1,271 | $84,387 | $0 | $0 |
| 2017 | $1,256 | $84,387 | $0 | $0 |
| 2016 | $1,133 | $84,387 | $0 | $0 |
| 2015 | $1,133 | $84,387 | $0 | $0 |
| 2014 | $1,125 | $84,387 | $0 | $0 |
| 2013 | $1,179 | $87,590 | $0 | $0 |
Source: Public Records
Map
Nearby Homes
Your Personal Tour Guide
Ask me questions while you tour the home.