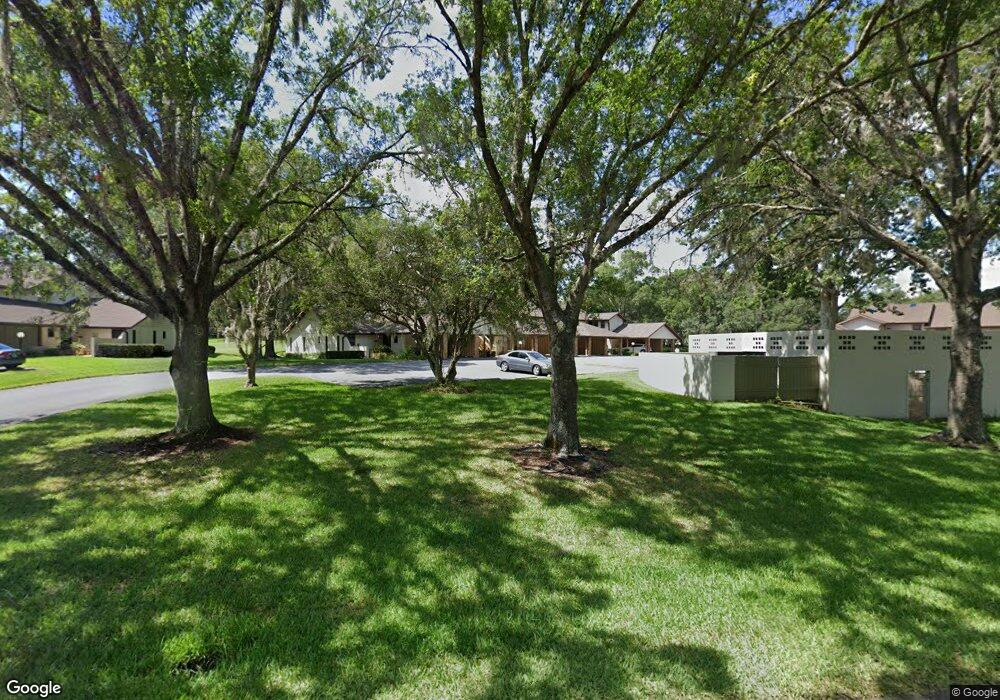
340 E Glassboro Ct Unit 3A Hernando, FL 34442
Estimated Value: $142,705 - $197,000
2
Beds
2
Baths
990
Sq Ft
$162/Sq Ft
Est. Value
About This Home
This home is located at 340 E Glassboro Ct Unit 3A, Hernando, FL 34442 and is currently estimated at $159,926, approximately $161 per square foot. 340 E Glassboro Ct Unit 3A is a home located in Citrus County with nearby schools including Forest Ridge Elementary School, Lecanto Middle School, and Lecanto High School.
Ownership History
Date
Name
Owned For
Owner Type
Purchase Details
Closed on
Nov 7, 2023
Sold by
Tuman Phillip F and Tuman Evelyn A
Bought by
Niebrugge Ronald L and Tuman Robert S
Current Estimated Value
Purchase Details
Closed on
Mar 19, 2012
Sold by
Stephan Vernon W and Stephan Nancy J
Bought by
Tuman Phillip F and Tuman Evelyn A
Purchase Details
Closed on
Jan 12, 2006
Sold by
Stephan Vernon W and Stephan Nancy J
Bought by
Stephan Vernon W and Stephan Nancy J
Purchase Details
Closed on
Jan 1, 2006
Bought by
Tuman Phillip F and Tuman Evelyn A
Purchase Details
Closed on
Dec 2, 2005
Sold by
Qualls Jeffrey D and Qualls Nancy J
Bought by
Stephan Vernon W and Stephan Nancy J
Purchase Details
Closed on
Apr 23, 2003
Sold by
Anderson Kenneth D and Anderson Lynda B
Bought by
Qualls Jeffrey D and Qualls Nancy J
Purchase Details
Closed on
Sep 1, 1984
Bought by
Tuman Phillip F and Tuman Evelyn A
Create a Home Valuation Report for This Property
The Home Valuation Report is an in-depth analysis detailing your home's value as well as a comparison with similar homes in the area
Home Values in the Area
Average Home Value in this Area
Purchase History
| Date | Buyer | Sale Price | Title Company |
|---|---|---|---|
| Niebrugge Ronald L | -- | None Listed On Document | |
| Niebrugge Ronald L | -- | None Listed On Document | |
| Tuman Phillip F | $65,300 | Manatee Title Company Inc | |
| Stephan Vernon W | -- | None Available | |
| Tuman Phillip F | $100 | -- | |
| Stephan Vernon W | $118,000 | Dba Crystal River Title | |
| Qualls Jeffrey D | $70,000 | Manatee Title Company Inc | |
| Tuman Phillip F | $55,900 | -- |
Source: Public Records
Tax History
| Year | Tax Paid | Tax Assessment Tax Assessment Total Assessment is a certain percentage of the fair market value that is determined by local assessors to be the total taxable value of land and additions on the property. | Land | Improvement |
|---|---|---|---|---|
| 2025 | $1,750 | $120,780 | -- | $120,780 |
| 2024 | $1,503 | $143,550 | -- | $143,550 |
| 2023 | $1,503 | $80,963 | $0 | $0 |
| 2022 | $1,395 | $108,900 | $0 | $108,900 |
| 2021 | $1,187 | $83,160 | $0 | $83,160 |
| 2020 | $1,050 | $71,280 | $0 | $71,280 |
| 2019 | $981 | $65,340 | $0 | $65,340 |
| 2018 | $870 | $55,440 | $0 | $55,440 |
| 2017 | $815 | $50,490 | $0 | $0 |
| 2016 | $778 | $46,340 | $17,000 | $29,340 |
| 2015 | $695 | $37,770 | $13,074 | $24,696 |
| 2014 | $717 | $37,770 | $0 | $0 |
Source: Public Records
Map
Nearby Homes
- 333 E Hartford St Unit 1B
- 370 E Glassboro Ct
- 240 E Glassboro Ct Unit 4A
- 261 E Hartford St Unit 1A
- 186 E Glassboro Ct Unit 4B
- 226 E Hartford St
- 156 E Glassboro Ct Unit 5A
- 175 E Hartford St Unit 5A
- 115 E Hartford St
- 115 E Hartford St Unit 4A
- 451 E Ireland Ct
- 95 E Hartford St Unit 7-A
- 489 E Falconry Ct
- 65 E Hartford St Unit 3A
- 560 E Falconry Ct
- 115 E Ireland Ct
- 197 E Joplin Ct
- 640 E Hartford St
- 720 E Gilchrist Ct Unit 5A
- 295 E Keller Ct
- 340 E Glassboro Ct Unit 1B
- 340 E Glassboro Ct Unit Bldg 19-5A
- 340 E Glassboro Ct Unit 4B
- 340 E Glassboro Ct Unit 2A
- 340 E Glassboro Ct Unit 19-5A
- 340 E Glassboro Ct Unit 6A
- 340 E Glassboro Ct Unit bldg-19 Unit-1B
- 340 E Glassboro Ct Unit 19-6A
- 340 Unit 3B Bldg 19 E Glassboro Ct Unit 19
- 340 E Glassboro Ct
- 340 E Glassboro Ct Unit 3-B Bldg 19
- 340 E Glassboro Ct Unit 5A
- 340 E Glassboro Ct Unit 19
- 340 E Glassboro Ct Unit 3B
- 340 E Glassboro Ct
- 340 E Glassboro Ct
- 340 E Glassboro Ct
- 340 E Glassboro Ct
- 340 E Glassboro Ct
- 340 E Glassboro Ct
Your Personal Tour Guide
Ask me questions while you tour the home.