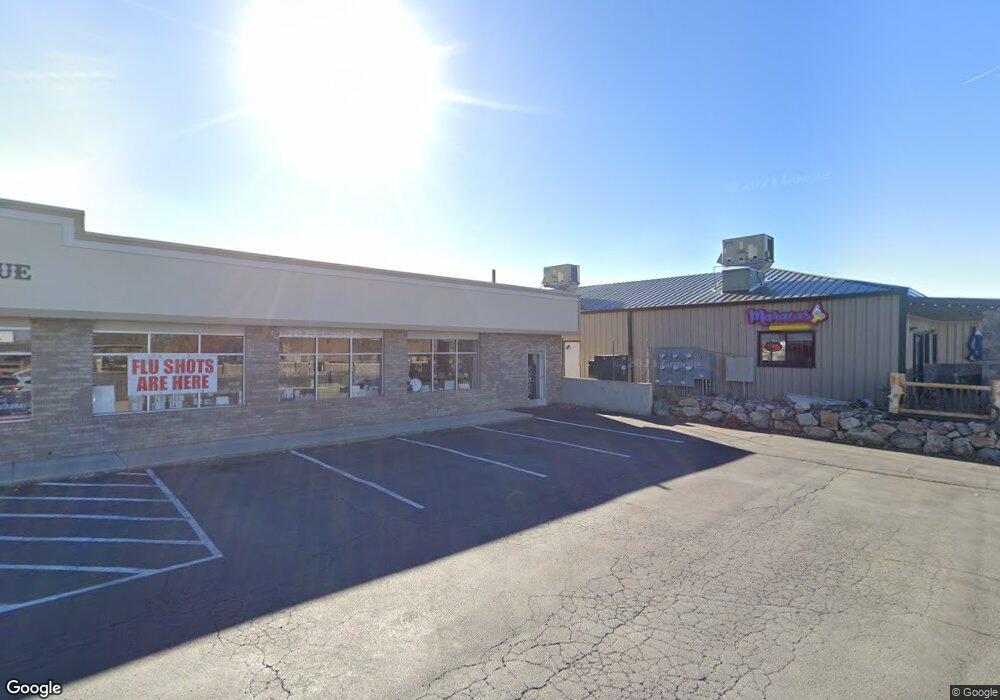
340 E Main St Santaquin, UT 84655
Studio
--
Bath
900
Sq Ft
21,780
Sq Ft
About This Home
This home is located at 340 E Main St, Santaquin, UT 84655. 340 E Main St is a home located in Utah County with nearby schools including Santaquin Elementary School, Payson Junior High School, and Mt. Nebo Middle.
Ownership History
Date
Name
Owned For
Owner Type
Purchase Details
Closed on
Jun 15, 2009
Sold by
Cattoor Enterprises Llc
Bought by
Crazy Daisy Mini Mall Llc
Purchase Details
Closed on
Jun 9, 2005
Sold by
Crazy Daisy Floral Salon Llc
Bought by
Cattoor Enterprises Llc
Purchase Details
Closed on
Oct 7, 2003
Sold by
Cattoor Enterprises Llc
Bought by
Crazy Daisy Floral Salon Llc
Home Financials for this Owner
Home Financials are based on the most recent Mortgage that was taken out on this home.
Original Mortgage
$500,000
Interest Rate
6.27%
Mortgage Type
Construction
Create a Home Valuation Report for This Property
The Home Valuation Report is an in-depth analysis detailing your home's value as well as a comparison with similar homes in the area
Home Values in the Area
Average Home Value in this Area
Purchase History
| Date | Buyer | Sale Price | Title Company |
|---|---|---|---|
| Crazy Daisy Mini Mall Llc | -- | None Available | |
| Cattoor Enterprises Llc | -- | Juab Title & Abstract Co | |
| Crazy Daisy Floral Salon Llc | -- | First American Title Co |
Source: Public Records
Mortgage History
| Date | Status | Borrower | Loan Amount |
|---|---|---|---|
| Previous Owner | Crazy Daisy Floral Salon Llc | $500,000 |
Source: Public Records
Tax History
| Year | Tax Paid | Tax Assessment Tax Assessment Total Assessment is a certain percentage of the fair market value that is determined by local assessors to be the total taxable value of land and additions on the property. | Land | Improvement |
|---|---|---|---|---|
| 2025 | $8,612 | $831,800 | $193,300 | $638,500 |
| 2024 | $8,612 | $857,600 | $0 | $0 |
| 2023 | $7,582 | $757,400 | $0 | $0 |
| 2022 | $6,566 | $676,600 | $156,700 | $519,900 |
| 2021 | $6,172 | $542,200 | $86,900 | $455,300 |
| 2020 | $6,704 | $570,700 | $86,900 | $483,800 |
| 2019 | $6,455 | $561,900 | $77,500 | $484,400 |
| 2018 | $6,527 | $541,800 | $73,200 | $468,600 |
| 2017 | $6,436 | $519,000 | $0 | $0 |
| 2016 | $6,527 | $515,700 | $0 | $0 |
| 2015 | $6,639 | $514,500 | $0 | $0 |
| 2014 | $6,643 | $513,800 | $0 | $0 |
Source: Public Records
Map
Nearby Homes
Your Personal Tour Guide
Ask me questions while you tour the home.