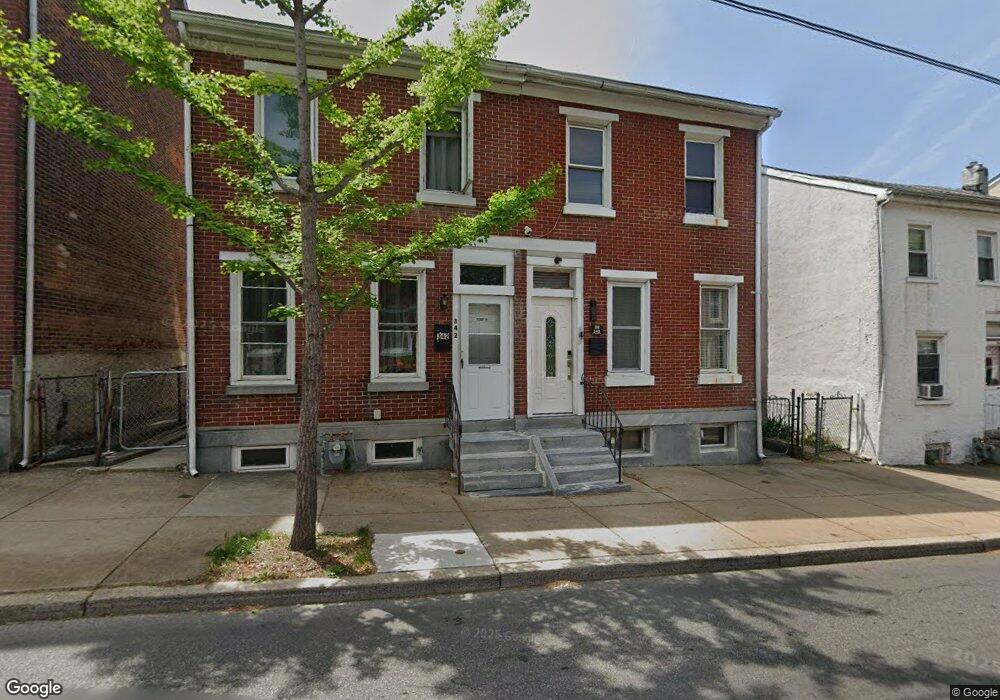
340 E Marshall St Norristown, PA 19401
Estimated Value: $137,318 - $234,000
4
Beds
1
Bath
1,720
Sq Ft
$106/Sq Ft
Est. Value
About This Home
This home is located at 340 E Marshall St, Norristown, PA 19401 and is currently estimated at $181,830, approximately $105 per square foot. 340 E Marshall St is a home located in Montgomery County with nearby schools including Charles Blockson Middle School, East Norriton Middle School, and Paul V Fly Elementary School.
Ownership History
Date
Name
Owned For
Owner Type
Purchase Details
Closed on
Aug 26, 2022
Sold by
Djc Company Limited Llc
Bought by
Gonzalez Alejandro Vazquez and Tellez Sandra Carmona
Current Estimated Value
Purchase Details
Closed on
Oct 26, 2006
Sold by
Hud
Bought by
Abiaad Maroun
Home Financials for this Owner
Home Financials are based on the most recent Mortgage that was taken out on this home.
Original Mortgage
$87,000
Interest Rate
6.31%
Purchase Details
Closed on
Apr 11, 2006
Sold by
Chase Home Fin Llc
Bought by
Hud
Purchase Details
Closed on
Feb 23, 2006
Sold by
Hampton Fred and Salters Wanda
Bought by
Chase Home Fin Llc
Purchase Details
Closed on
Aug 20, 1999
Sold by
Tri Star Properties
Bought by
Hampton Fred and Salters Wanda
Purchase Details
Closed on
Dec 9, 1998
Sold by
Hud
Bought by
Tri Star Properties
Purchase Details
Closed on
Aug 7, 1998
Sold by
Nationsbanc Mtg Corp and Hall Richard S
Bought by
Hud
Create a Home Valuation Report for This Property
The Home Valuation Report is an in-depth analysis detailing your home's value as well as a comparison with similar homes in the area
Home Values in the Area
Average Home Value in this Area
Purchase History
| Date | Buyer | Sale Price | Title Company |
|---|---|---|---|
| Gonzalez Alejandro Vazquez | $90,000 | -- | |
| Abiaad Maroun | $70,000 | None Available | |
| Hud | -- | None Available | |
| Chase Home Fin Llc | $1,572 | None Available | |
| Hampton Fred | $64,000 | -- | |
| Tri Star Properties | $16,000 | -- | |
| Hud | $1,312 | -- |
Source: Public Records
Mortgage History
| Date | Status | Borrower | Loan Amount |
|---|---|---|---|
| Previous Owner | Abiaad Maroun | $87,000 |
Source: Public Records
Tax History Compared to Growth
Tax History
| Year | Tax Paid | Tax Assessment Tax Assessment Total Assessment is a certain percentage of the fair market value that is determined by local assessors to be the total taxable value of land and additions on the property. | Land | Improvement |
|---|---|---|---|---|
| 2025 | $1,885 | $30,720 | $21,360 | $9,360 |
| 2024 | $1,885 | $30,720 | $21,360 | $9,360 |
| 2023 | $1,868 | $30,720 | $21,360 | $9,360 |
| 2022 | $1,828 | $30,720 | $21,360 | $9,360 |
| 2021 | $1,819 | $30,720 | $21,360 | $9,360 |
| 2020 | $1,736 | $30,720 | $21,360 | $9,360 |
| 2019 | $1,704 | $30,720 | $21,360 | $9,360 |
| 2018 | $1,134 | $30,720 | $21,360 | $9,360 |
| 2017 | $1,565 | $30,720 | $21,360 | $9,360 |
| 2016 | $1,552 | $30,720 | $21,360 | $9,360 |
| 2015 | $1,488 | $30,720 | $21,360 | $9,360 |
| 2014 | $1,488 | $30,720 | $21,360 | $9,360 |
Source: Public Records
Map
Nearby Homes
- 338 E Marshall St
- 342 E Marshall St
- 344 E Marshall St
- 336 E Marshall St
- 346 E Marshall St
- 334 E Marshall St
- 348 E Marshall St
- 332 E Marshall St
- 350 E Marshall St
- 330 E Marshall St
- 352 E Marshall St
- 328 E Marshall St
- 351 E Moore St
- 349 E Moore St
- 353 E Moore St
- 357 E Moore St
- 347 E Moore St
- 345 E Moore St Unit 22
- 354 E Marshall St
- 343 E Moore St