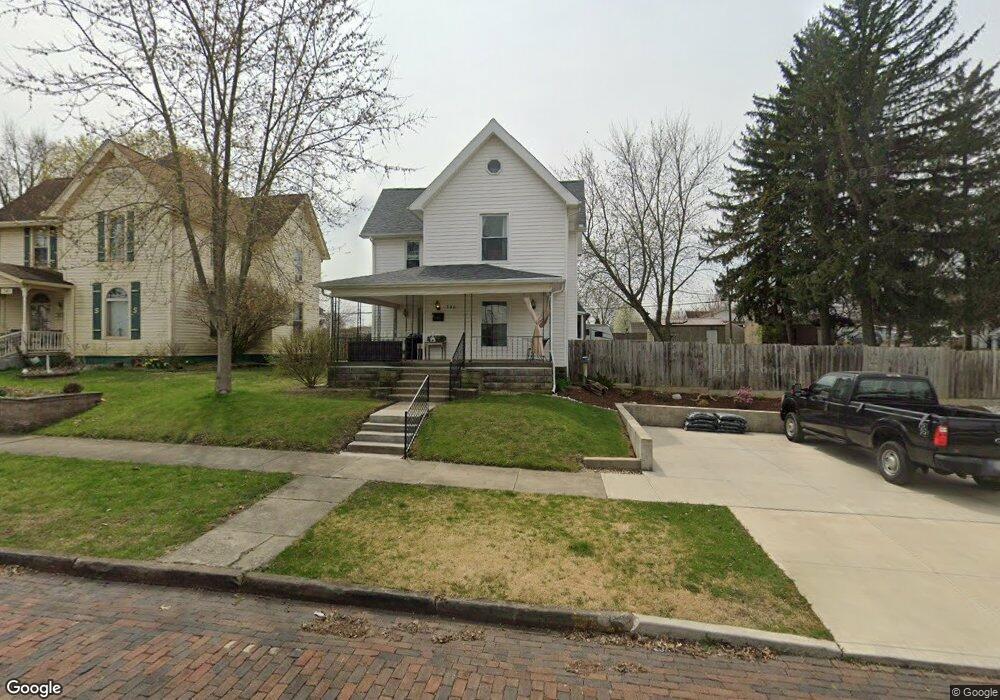
340 E Sherman St Marion, IN 46952
Northeast Marion NeighborhoodEstimated Value: $101,000 - $121,000
4
Beds
2
Baths
1,608
Sq Ft
$69/Sq Ft
Est. Value
About This Home
This home is located at 340 E Sherman St, Marion, IN 46952 and is currently estimated at $110,711, approximately $68 per square foot. 340 E Sherman St is a home located in Grant County with nearby schools including Allen Elementary School, Justice Thurgood Marshall Intermediate School, and John L. McCulloch Junior High School.
Ownership History
Date
Name
Owned For
Owner Type
Purchase Details
Closed on
Sep 26, 2018
Sold by
Huizinga Jack
Bought by
Huizinga Jack and Huizinga Victoria
Current Estimated Value
Purchase Details
Closed on
May 29, 2007
Sold by
M & I Bank Fsb
Bought by
Huizinga Jack
Purchase Details
Closed on
Oct 31, 2006
Sold by
Huston Allen and Huston Marilyn
Bought by
M & I Bank Fsb
Create a Home Valuation Report for This Property
The Home Valuation Report is an in-depth analysis detailing your home's value as well as a comparison with similar homes in the area
Home Values in the Area
Average Home Value in this Area
Purchase History
| Date | Buyer | Sale Price | Title Company |
|---|---|---|---|
| Huizinga Jack | -- | -- | |
| Huizinga Jack | -- | None Available | |
| M & I Bank Fsb | $17,751 | None Available |
Source: Public Records
Tax History
| Year | Tax Paid | Tax Assessment Tax Assessment Total Assessment is a certain percentage of the fair market value that is determined by local assessors to be the total taxable value of land and additions on the property. | Land | Improvement |
|---|---|---|---|---|
| 2025 | $993 | $104,600 | $5,900 | $98,700 |
| 2024 | $993 | $99,300 | $6,600 | $92,700 |
| 2023 | $1,051 | $94,200 | $6,600 | $87,600 |
| 2022 | $1,092 | $88,300 | $6,300 | $82,000 |
| 2021 | $985 | $78,500 | $6,300 | $72,200 |
| 2020 | $769 | $73,300 | $6,300 | $67,000 |
| 2019 | $526 | $62,100 | $6,300 | $55,800 |
| 2018 | $424 | $60,100 | $6,300 | $53,800 |
| 2017 | $404 | $59,500 | $6,300 | $53,200 |
| 2016 | $367 | $58,200 | $6,300 | $51,900 |
| 2014 | $361 | $57,600 | $6,300 | $51,300 |
| 2013 | $361 | $58,200 | $6,300 | $51,900 |
Source: Public Records
Map
Nearby Homes
- 510 E Grant St
- 425 E Bradford St
- 558 E Swayzee St
- 410 E Lincoln St
- 618 N Branson St
- 622 N Washington St
- 624 N Washington St
- 420 W 1st St
- 112 S Nebraska St
- 932 N Washington St
- 209 S Whites Ave
- 718 W Nelson St
- 608 W 3rd St
- 636 W 2nd St
- 717 W Nelson St
- 605 W Buckingham Dr
- 617 Berkley Dr
- 528 E Wiley St
- 1113 E Grant St
- 214 N D St
- 342 E Sherman St
- 338 E Sherman St
- 350 E Sherman St
- 336 E Sherman St
- 334 E Sherman St
- 330 E Sherman St
- 337 E Swayzee St
- 335 E Swayzee St
- 349 E Swayzee St
- 333 E Swayzee St
- 366 E Sherman St
- 326 E Sherman St
- 343 E Sherman St
- 339 E Sherman St
- 349 E Sherman St
- 353 E Swayzee St
- 337 E Sherman St
- 357 E Swayzee St
- 351 E Sherman St
- 324 E Sherman St
Your Personal Tour Guide
Ask me questions while you tour the home.