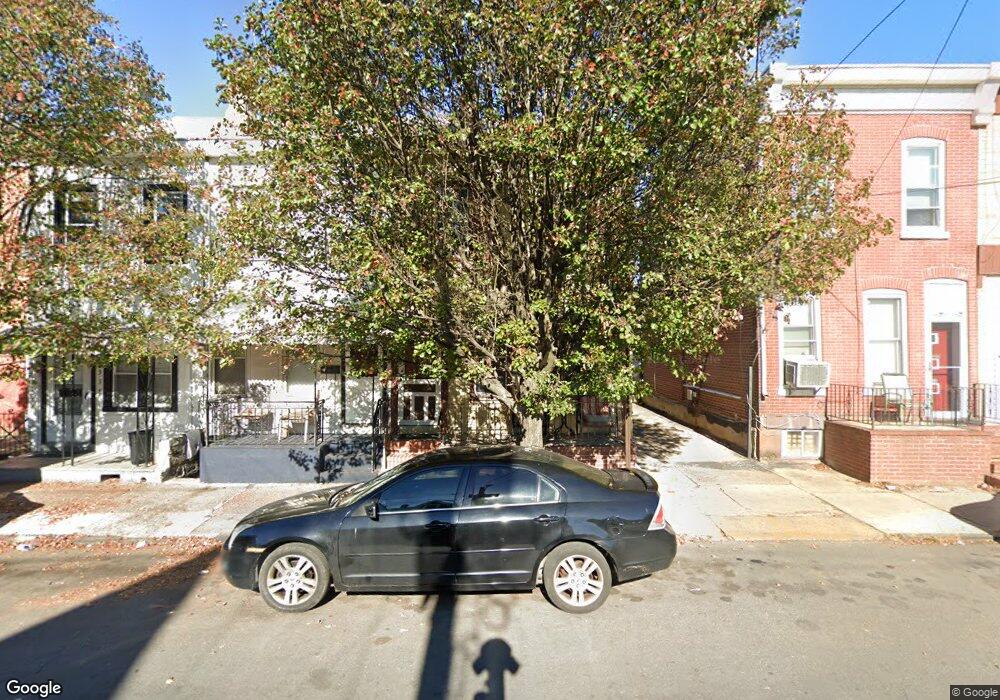
340 Elmer St Trenton, NJ 08611
Chambersburg NeighborhoodEstimated Value: $161,454 - $187,000
--
Bed
--
Bath
1,344
Sq Ft
$130/Sq Ft
Est. Value
About This Home
This home is located at 340 Elmer St, Trenton, NJ 08611 and is currently estimated at $174,614, approximately $129 per square foot. 340 Elmer St is a home located in Mercer County with nearby schools including Robbins Elementary School, Monument Elementary School, and Dr. Martin Luther King Middle School.
Ownership History
Date
Name
Owned For
Owner Type
Purchase Details
Closed on
Feb 29, 2024
Sold by
Weber Elya
Bought by
340 Elmerr St Llc
Current Estimated Value
Purchase Details
Closed on
Jun 22, 2023
Sold by
Young And Wise Llc
Bought by
340 Elmer St Llc
Purchase Details
Closed on
Jun 5, 2023
Sold by
Weiss Faigel
Bought by
Young And Wise Llc
Purchase Details
Closed on
Sep 30, 2005
Sold by
Semah Samuel
Bought by
Weiss Faigel
Home Financials for this Owner
Home Financials are based on the most recent Mortgage that was taken out on this home.
Original Mortgage
$76,500
Interest Rate
5.85%
Purchase Details
Closed on
Oct 27, 2003
Sold by
Sacco Eleanore
Bought by
Semah Samuel
Home Financials for this Owner
Home Financials are based on the most recent Mortgage that was taken out on this home.
Original Mortgage
$63,000
Interest Rate
5.98%
Create a Home Valuation Report for This Property
The Home Valuation Report is an in-depth analysis detailing your home's value as well as a comparison with similar homes in the area
Home Values in the Area
Average Home Value in this Area
Purchase History
| Date | Buyer | Sale Price | Title Company |
|---|---|---|---|
| 340 Elmerr St Llc | -- | Lakeland Abstract | |
| 340 Elmerr St Llc | -- | Lakeland Abstract | |
| 340 Elmer St Llc | $102,000 | River Edge Title | |
| 340 Elmer St Llc | $102,000 | River Edge Title | |
| Young And Wise Llc | $81,000 | River Edge Title | |
| Young And Wise Llc | $81,000 | River Edge Title | |
| Weiss Faigel | $85,000 | -- | |
| Semah Samuel | $70,000 | -- |
Source: Public Records
Mortgage History
| Date | Status | Borrower | Loan Amount |
|---|---|---|---|
| Previous Owner | Weiss Faigel | $76,500 | |
| Previous Owner | Semah Samuel | $63,000 |
Source: Public Records
Tax History Compared to Growth
Tax History
| Year | Tax Paid | Tax Assessment Tax Assessment Total Assessment is a certain percentage of the fair market value that is determined by local assessors to be the total taxable value of land and additions on the property. | Land | Improvement |
|---|---|---|---|---|
| 2025 | $2,883 | $49,700 | $8,100 | $41,600 |
| 2024 | $2,767 | $49,700 | $8,100 | $41,600 |
| 2023 | $2,767 | $49,700 | $8,100 | $41,600 |
| 2022 | $2,713 | $49,700 | $8,100 | $41,600 |
| 2021 | $2,760 | $49,700 | $8,100 | $41,600 |
| 2020 | $2,751 | $49,700 | $8,100 | $41,600 |
| 2019 | $2,707 | $49,700 | $8,100 | $41,600 |
| 2018 | $2,591 | $49,700 | $8,100 | $41,600 |
| 2017 | $2,463 | $49,700 | $8,100 | $41,600 |
| 2016 | $3,256 | $56,600 | $17,200 | $39,400 |
| 2015 | $3,245 | $56,600 | $17,200 | $39,400 |
| 2014 | $3,230 | $56,600 | $17,200 | $39,400 |
Source: Public Records
Map
Nearby Homes