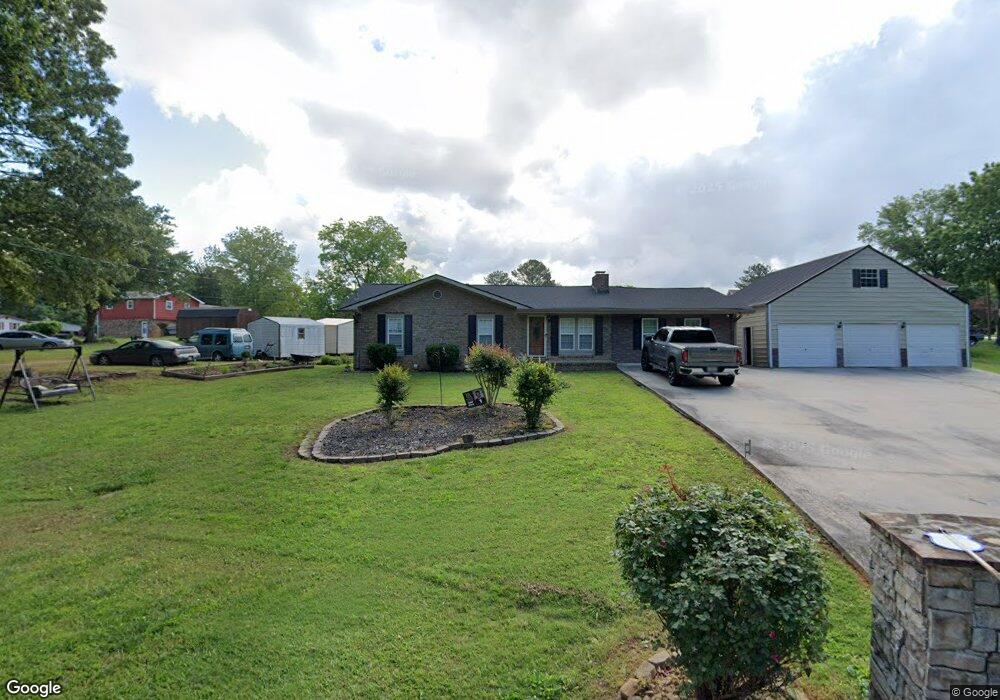
340 Henson Cir Carrollton, GA 30117
Abilene NeighborhoodEstimated Value: $207,000 - $239,000
3
Beds
2
Baths
1,154
Sq Ft
$191/Sq Ft
Est. Value
About This Home
This home is located at 340 Henson Cir, Carrollton, GA 30117 and is currently estimated at $220,247, approximately $190 per square foot. 340 Henson Cir is a home located in Carroll County with nearby schools including Sharp Creek Elementary School, Central Middle School, and Central High School.
Ownership History
Date
Name
Owned For
Owner Type
Purchase Details
Closed on
Feb 28, 2025
Sold by
Nneuner Dyla
Bought by
Neuner Kelsey
Current Estimated Value
Home Financials for this Owner
Home Financials are based on the most recent Mortgage that was taken out on this home.
Original Mortgage
$213,400
Outstanding Balance
$212,142
Interest Rate
6.95%
Mortgage Type
New Conventional
Estimated Equity
$8,105
Purchase Details
Closed on
Jun 23, 2010
Sold by
Federal National Mortgage Association
Bought by
Horn Isaac D
Purchase Details
Closed on
Apr 6, 2010
Sold by
Chase Home Finance Llc
Bought by
Federal National Mtg Associati
Purchase Details
Closed on
Jan 27, 2005
Sold by
Johnson Veronica L
Bought by
Delaney Tabetha
Purchase Details
Closed on
Oct 13, 1999
Sold by
Knight
Bought by
Johnson Veronica L
Purchase Details
Closed on
Sep 23, 1992
Bought by
Knight
Create a Home Valuation Report for This Property
The Home Valuation Report is an in-depth analysis detailing your home's value as well as a comparison with similar homes in the area
Home Values in the Area
Average Home Value in this Area
Purchase History
| Date | Buyer | Sale Price | Title Company |
|---|---|---|---|
| Neuner Kelsey | -- | -- | |
| Neuner Dylan | -- | -- | |
| Horn Isaac D | $25,900 | -- | |
| Federal National Mtg Associati | $90,341 | -- | |
| Chase Home Finance Llc | $90,341 | -- | |
| Delaney Tabetha | $70,000 | -- | |
| Johnson Veronica L | $79,900 | -- | |
| Knight | $55,300 | -- |
Source: Public Records
Mortgage History
| Date | Status | Borrower | Loan Amount |
|---|---|---|---|
| Open | Neuner Dylan | $213,400 |
Source: Public Records
Tax History Compared to Growth
Tax History
| Year | Tax Paid | Tax Assessment Tax Assessment Total Assessment is a certain percentage of the fair market value that is determined by local assessors to be the total taxable value of land and additions on the property. | Land | Improvement |
|---|---|---|---|---|
| 2024 | $1,305 | $57,691 | $4,000 | $53,691 |
| 2023 | $1,305 | $52,887 | $4,000 | $48,887 |
| 2022 | $1,084 | $43,220 | $4,000 | $39,220 |
| 2021 | $967 | $37,728 | $4,000 | $33,728 |
| 2020 | $866 | $33,728 | $4,000 | $29,728 |
| 2019 | $808 | $31,206 | $4,000 | $27,206 |
| 2018 | $589 | $22,426 | $1,600 | $20,826 |
| 2017 | $591 | $22,426 | $1,600 | $20,826 |
| 2016 | $591 | $22,426 | $1,600 | $20,826 |
| 2015 | $691 | $24,722 | $6,000 | $18,723 |
| 2014 | $694 | $24,723 | $6,000 | $18,723 |
Source: Public Records
Map
Nearby Homes
- 345 Henson Cir
- 0 Henson Cir Unit 10584639
- 0 Henson Cir Unit 7632920
- 219 Candlewood Dr
- 70 Henson Cir
- 114 Kyle Way
- 125 Springwood Dr
- 85 Mary Ln
- 524 Old Bremen Rd
- 300 Georgia 113
- 110 Sharp Dr
- 281 Northwinds Blvd
- 281 Northwinds Blvd Unit B3
- 281 Northwinds Blvd Unit D3
- 70 W Meadowcliff Cir
- 0 Center Point Rd Unit TR 3 10274074
- 0 Center Point Rd Unit 7361099
- 45 Buell Jones Rd
- 2464 N 27 Highway & Bagwell Rd
- 102 Buell Jones Rd