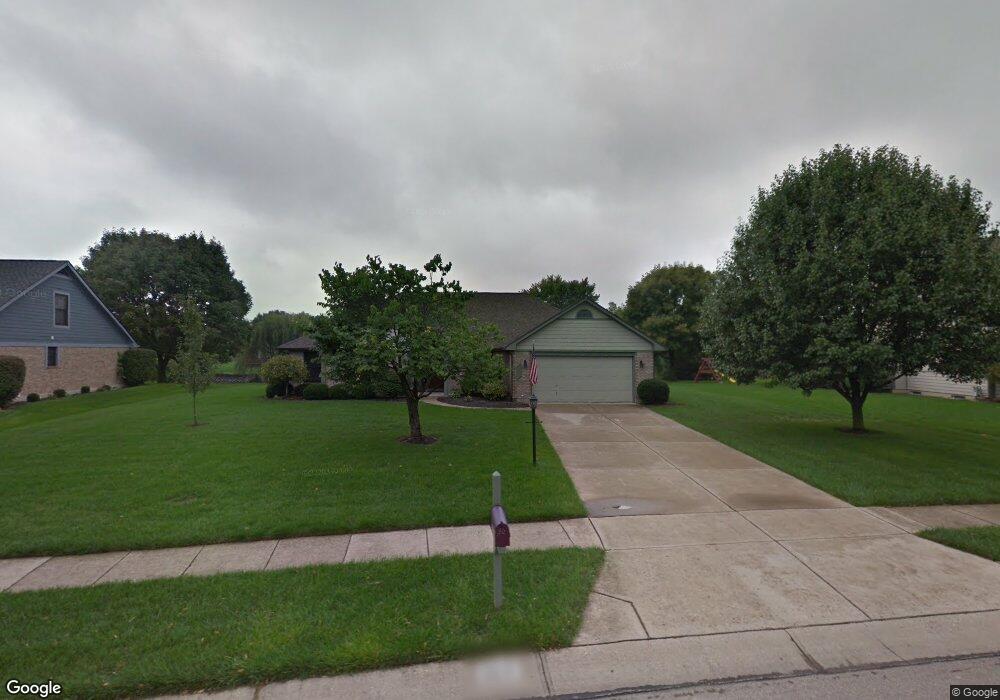
340 Mapletrace Trail Dayton, OH 45458
Estimated Value: $383,520 - $494,000
3
Beds
2
Baths
1,967
Sq Ft
$216/Sq Ft
Est. Value
About This Home
This home is located at 340 Mapletrace Trail, Dayton, OH 45458 and is currently estimated at $424,630, approximately $215 per square foot. 340 Mapletrace Trail is a home located in Montgomery County with nearby schools including Primary Village South, Cline Elementary, and Magsig Middle School.
Ownership History
Date
Name
Owned For
Owner Type
Purchase Details
Closed on
Jun 25, 2020
Sold by
Ledger Walter R
Bought by
Reynolds Sheila M
Current Estimated Value
Home Financials for this Owner
Home Financials are based on the most recent Mortgage that was taken out on this home.
Original Mortgage
$355,400
Outstanding Balance
$311,696
Interest Rate
3%
Mortgage Type
New Conventional
Estimated Equity
$112,934
Purchase Details
Closed on
Jul 17, 2009
Sold by
Barone James C and Barone Maureen M
Bought by
Ledger Walter R
Home Financials for this Owner
Home Financials are based on the most recent Mortgage that was taken out on this home.
Original Mortgage
$150,800
Interest Rate
5.62%
Mortgage Type
Purchase Money Mortgage
Purchase Details
Closed on
Jul 5, 2001
Sold by
Cline Michael C and Cline Melinda R
Bought by
Barone James C and Barone Maureen M
Home Financials for this Owner
Home Financials are based on the most recent Mortgage that was taken out on this home.
Original Mortgage
$148,400
Interest Rate
5.87%
Create a Home Valuation Report for This Property
The Home Valuation Report is an in-depth analysis detailing your home's value as well as a comparison with similar homes in the area
Purchase History
| Date | Buyer | Sale Price | Title Company |
|---|---|---|---|
| Reynolds Sheila M | $294,000 | Landmark Ttl Agcy South Inc | |
| Ledger Walter R | $188,500 | Attorney | |
| Barone James C | $185,500 | -- |
Source: Public Records
Mortgage History
| Date | Status | Borrower | Loan Amount |
|---|---|---|---|
| Open | Reynolds Sheila M | $355,400 | |
| Previous Owner | Ledger Walter R | $150,800 | |
| Previous Owner | Barone James C | $148,400 | |
| Previous Owner | Barone James C | $18,550 |
Source: Public Records
Tax History
| Year | Tax Paid | Tax Assessment Tax Assessment Total Assessment is a certain percentage of the fair market value that is determined by local assessors to be the total taxable value of land and additions on the property. | Land | Improvement |
|---|---|---|---|---|
| 2025 | $7,387 | $110,150 | $23,310 | $86,840 |
| 2024 | $6,787 | $110,150 | $23,310 | $86,840 |
| 2023 | $6,787 | $110,150 | $23,310 | $86,840 |
| 2022 | $5,812 | $74,600 | $15,750 | $58,850 |
| 2021 | $5,828 | $74,600 | $15,750 | $58,850 |
| 2020 | $5,820 | $74,600 | $15,750 | $58,850 |
| 2019 | $5,966 | $68,340 | $15,750 | $52,590 |
| 2018 | $5,329 | $68,340 | $15,750 | $52,590 |
| 2017 | $5,272 | $68,340 | $15,750 | $52,590 |
| 2016 | $4,983 | $60,880 | $15,750 | $45,130 |
| 2015 | $4,903 | $60,880 | $15,750 | $45,130 |
| 2014 | $4,903 | $60,880 | $15,750 | $45,130 |
| 2012 | -- | $59,450 | $15,750 | $43,700 |
Source: Public Records
Map
Nearby Homes
- 1091 Quiet Brook Trail
- 930 Indigo Creek Cir
- 450 Jamestown Cir Unit 9
- 719 Clareridge Ln Unit 719
- 9750 Centerville Creek Ln
- 55 Gulfwood Ct
- 108 Mallard Glen Dr Unit 3
- 9610 Sagemeadow Ct
- 1145 Green Timber Trail
- 154 Queens Crossing Unit 31152
- 9363 Rochelle Ln
- 8661 Hide a Way Ln
- 9119 Remy
- 9106 Remy Ct
- 9971 Stonemeade Way
- 9963 Creek Landing Way
- 184 Edinburgh Village Dr Unit 13184
- 225 S Main St
- 662 Nutt Rd
- 9229 Bottega South Dr Unit 62
- 350 Mapletrace Trail
- 330 Mapletrace Trail
- 449 Maple Springs Dr
- 457 Maple Springs Dr
- 360 Mapletrace Trail
- 9231 Mintcreek Ct
- 331 Mapletrace Trail
- 441 Maple Springs Dr
- 320 Mapletrace Trail
- 465 Maple Springs Dr Unit 495
- 370 Mapletrace Trail
- 9162 Sugarbrook Ct
- 9232 Mintcreek Ct
- 321 Mapletrace Trail
- 433 Maple Springs Dr
- 473 Maple Springs Dr
- 9191 Atchison Rd
- 380 Mapletrace Trail
- 9221 Mintcreek Ct
- 9126 Sugarbrook Ct
Your Personal Tour Guide
Ask me questions while you tour the home.