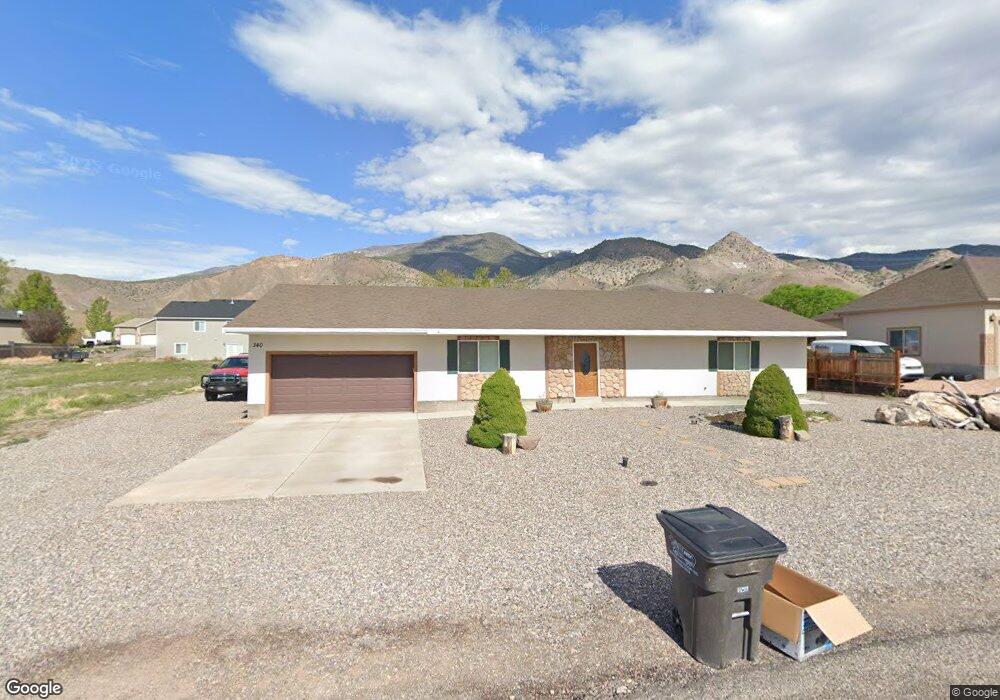
340 N 430 E Monroe, UT 84754
Monroe NeighborhoodEstimated Value: $369,094 - $467,000
4
Beds
2
Baths
1,650
Sq Ft
$242/Sq Ft
Est. Value
About This Home
This home is located at 340 N 430 E, Monroe, UT 84754 and is currently estimated at $398,774, approximately $241 per square foot. 340 N 430 E is a home located in Sevier County with nearby schools including Monroe School, South Sevier Middle School, and South Sevier High School.
Ownership History
Date
Name
Owned For
Owner Type
Purchase Details
Closed on
Aug 31, 2022
Sold by
Dumm John P
Bought by
Gingell Steven
Current Estimated Value
Home Financials for this Owner
Home Financials are based on the most recent Mortgage that was taken out on this home.
Original Mortgage
$353,958
Outstanding Balance
$337,568
Interest Rate
5.54%
Mortgage Type
VA
Estimated Equity
$61,206
Purchase Details
Closed on
Oct 19, 2007
Sold by
Hamblin Judy
Bought by
Dumm John P and Dumm Michele I
Home Financials for this Owner
Home Financials are based on the most recent Mortgage that was taken out on this home.
Original Mortgage
$35,000
Interest Rate
6.27%
Mortgage Type
Unknown
Create a Home Valuation Report for This Property
The Home Valuation Report is an in-depth analysis detailing your home's value as well as a comparison with similar homes in the area
Home Values in the Area
Average Home Value in this Area
Purchase History
| Date | Buyer | Sale Price | Title Company |
|---|---|---|---|
| Gingell Steven | -- | First American Title | |
| Dumm John P | -- | Utah Title & Abstract |
Source: Public Records
Mortgage History
| Date | Status | Borrower | Loan Amount |
|---|---|---|---|
| Open | Gingell Steven | $353,958 | |
| Previous Owner | Dumm John P | $35,000 |
Source: Public Records
Tax History
| Year | Tax Paid | Tax Assessment Tax Assessment Total Assessment is a certain percentage of the fair market value that is determined by local assessors to be the total taxable value of land and additions on the property. | Land | Improvement |
|---|---|---|---|---|
| 2025 | $1,621 | $180,025 | $34,989 | $145,036 |
| 2024 | $1,621 | $185,580 | $31,805 | $153,775 |
| 2023 | $1,700 | $185,348 | $32,544 | $152,804 |
| 2022 | $1,584 | $150,172 | $25,693 | $124,479 |
| 2021 | $1,749 | $137,123 | $16,170 | $120,953 |
| 2020 | $1,597 | $117,369 | $15,400 | $101,969 |
| 2019 | $1,374 | $106,070 | $13,860 | $92,210 |
| 2018 | $1,285 | $88,250 | $12,320 | $75,930 |
| 2017 | $1,174 | $83,750 | $13,240 | $70,510 |
| 2016 | $887 | $82,200 | $0 | $0 |
| 2015 | $887 | $82,200 | $0 | $0 |
| 2014 | $887 | $82,200 | $0 | $0 |
Source: Public Records
Map
Nearby Homes
Your Personal Tour Guide
Ask me questions while you tour the home.