Estimated Value: $57,000 - $94,000
3
Beds
1
Bath
1,250
Sq Ft
$60/Sq Ft
Est. Value
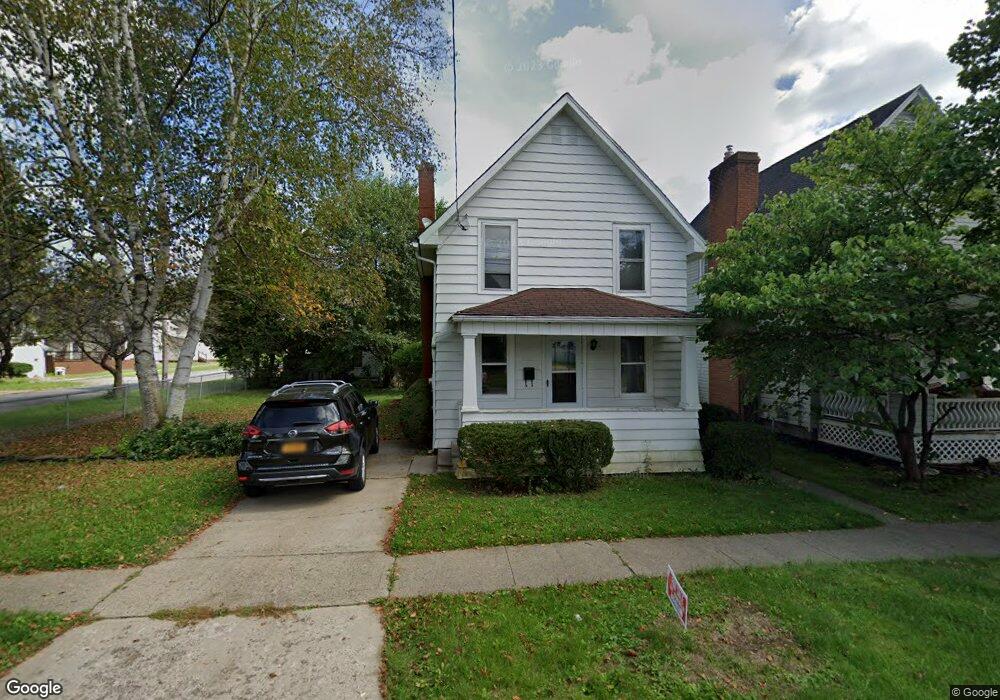
About This Home
This home is located at 340 N 8th St, Olean, NY 14760 and is currently estimated at $74,439, approximately $59 per square foot. 340 N 8th St is a home located in Cattaraugus County with nearby schools including Olean Intermediate-Middle School, Olean Senior High School, and Southern Tier Catholic School.
Ownership History
Date
Name
Owned For
Owner Type
Purchase Details
Closed on
Mar 1, 2024
Sold by
Olean 2020 Llc
Bought by
Butler Leonard and Hopkins Nancy
Current Estimated Value
Home Financials for this Owner
Home Financials are based on the most recent Mortgage that was taken out on this home.
Original Mortgage
$44,356
Outstanding Balance
$43,350
Interest Rate
6.6%
Mortgage Type
Purchase Money Mortgage
Estimated Equity
$31,089
Purchase Details
Closed on
Dec 15, 2021
Sold by
Park Centre Development
Bought by
Olean 2020 Llc
Purchase Details
Closed on
Dec 23, 2008
Sold by
Bean John
Bought by
Park Centre Development Inc
Create a Home Valuation Report for This Property
The Home Valuation Report is an in-depth analysis detailing your home's value as well as a comparison with similar homes in the area
Home Values in the Area
Average Home Value in this Area
Purchase History
| Date | Buyer | Sale Price | Title Company |
|---|---|---|---|
| Butler Leonard | $54,000 | None Available | |
| Olean 2020 Llc | $40,000 | None Available | |
| Park Centre Development Inc | $34,000 | Daniel A Derose |
Source: Public Records
Mortgage History
| Date | Status | Borrower | Loan Amount |
|---|---|---|---|
| Open | Butler Leonard | $44,356 |
Source: Public Records
Tax History
| Year | Tax Paid | Tax Assessment Tax Assessment Total Assessment is a certain percentage of the fair market value that is determined by local assessors to be the total taxable value of land and additions on the property. | Land | Improvement |
|---|---|---|---|---|
| 2025 | $2,150 | $34,000 | $2,700 | $31,300 |
| 2024 | $2,150 | $34,000 | $2,700 | $31,300 |
| 2023 | $1,280 | $34,000 | $2,700 | $31,300 |
| 2022 | $1,299 | $34,000 | $2,700 | $31,300 |
| 2021 | $1,336 | $34,000 | $2,700 | $31,300 |
| 2020 | $1,345 | $34,000 | $2,700 | $31,300 |
| 2019 | $510 | $34,000 | $2,700 | $31,300 |
| 2018 | $1,834 | $34,000 | $2,700 | $31,300 |
| 2017 | $1,378 | $34,000 | $2,700 | $31,300 |
| 2016 | $1,363 | $34,000 | $2,700 | $31,300 |
| 2015 | -- | $34,000 | $2,700 | $31,300 |
| 2014 | -- | $34,000 | $2,700 | $31,300 |
Source: Public Records
Map
Nearby Homes
Your Personal Tour Guide
Ask me questions while you tour the home.