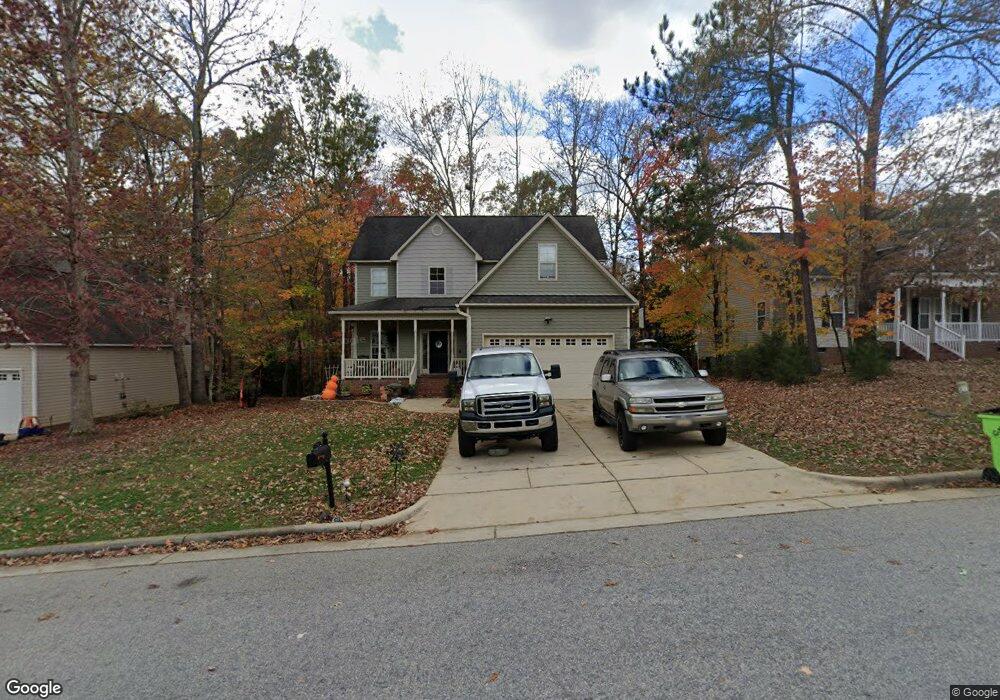
340 N Farm Dr Unit L 98 Clayton, NC 27527
Estimated Value: $336,000 - $348,516
3
Beds
3
Baths
1,560
Sq Ft
$221/Sq Ft
Est. Value
About This Home
This home is located at 340 N Farm Dr Unit L 98, Clayton, NC 27527 and is currently estimated at $344,629, approximately $220 per square foot. 340 N Farm Dr Unit L 98 is a home located in Johnston County with nearby schools including River Dell Elementary School, Archer Lodge Middle School, and Corinth Holders High School.
Ownership History
Date
Name
Owned For
Owner Type
Purchase Details
Closed on
Jun 7, 2016
Sold by
Phillips Tiffany Nicole and Rowe Jason Wayne
Bought by
Craft Jeffrey Thomas and Craft Heather Caroline
Current Estimated Value
Home Financials for this Owner
Home Financials are based on the most recent Mortgage that was taken out on this home.
Original Mortgage
$185,089
Outstanding Balance
$147,502
Interest Rate
3.61%
Mortgage Type
New Conventional
Estimated Equity
$197,127
Purchase Details
Closed on
May 27, 2009
Sold by
Rivers Edge Construction Inc
Bought by
Phillips Tiffany Nicole and Rowe Jason Wayne
Home Financials for this Owner
Home Financials are based on the most recent Mortgage that was taken out on this home.
Original Mortgage
$176,641
Interest Rate
4.77%
Mortgage Type
FHA
Purchase Details
Closed on
Mar 19, 2008
Sold by
S&S Land Development Llc
Bought by
Rivers Edge Construction Inc
Create a Home Valuation Report for This Property
The Home Valuation Report is an in-depth analysis detailing your home's value as well as a comparison with similar homes in the area
Home Values in the Area
Average Home Value in this Area
Purchase History
| Date | Buyer | Sale Price | Title Company |
|---|---|---|---|
| Craft Jeffrey Thomas | $180,000 | None Available | |
| Phillips Tiffany Nicole | $180,000 | None Available | |
| Rivers Edge Construction Inc | $72,000 | None Available |
Source: Public Records
Mortgage History
| Date | Status | Borrower | Loan Amount |
|---|---|---|---|
| Open | Craft Jeffrey Thomas | $185,089 | |
| Previous Owner | Phillips Tiffany Nicole | $176,641 |
Source: Public Records
Tax History Compared to Growth
Tax History
| Year | Tax Paid | Tax Assessment Tax Assessment Total Assessment is a certain percentage of the fair market value that is determined by local assessors to be the total taxable value of land and additions on the property. | Land | Improvement |
|---|---|---|---|---|
| 2025 | $2,009 | $316,420 | $75,000 | $241,420 |
| 2024 | $1,590 | $196,260 | $43,000 | $153,260 |
| 2023 | $1,590 | $196,260 | $43,000 | $153,260 |
| 2022 | $1,609 | $196,260 | $43,000 | $153,260 |
| 2021 | $1,609 | $196,260 | $43,000 | $153,260 |
| 2020 | $1,668 | $196,260 | $43,000 | $153,260 |
| 2019 | $1,668 | $196,260 | $43,000 | $153,260 |
| 2018 | $1,523 | $175,060 | $35,000 | $140,060 |
| 2017 | $1,488 | $175,060 | $35,000 | $140,060 |
| 2016 | $1,520 | $175,060 | $35,000 | $140,060 |
| 2015 | $1,518 | $175,060 | $35,000 | $140,060 |
| 2014 | $1,518 | $175,060 | $35,000 | $140,060 |
Source: Public Records
Map
Nearby Homes
- 69 Cedar Grove Ct
- 87 Anderby Dr
- 39 Anderby Dr
- 155 Millwood Dr
- 39 Barrowby Dr
- 80 Summer Mist Ln Unit 165p
- 41 Capstone Dr
- 641 Bent Willow Dr Unit 128
- 641 Bent Willow Dr
- 115 Cottage Dr
- 54 Denby Cir
- 27 Silver Moon Ln
- 450 Windgate Dr
- 157 Curling Creek Dr
- 68 Radcliffe Ct
- 459 Windgate Dr
- 112 Radcliffe Ct
- Huntley Plan at Copper Ridge at Flowers Plantation
- Winslow Plan at Copper Ridge at Flowers Plantation
- Riley Plan at Copper Ridge at Flowers Plantation
- 340 North Farm Dr
- 340 N Farm Dr
- 356 North Farm Dr
- 356 N Farm Dr
- 356 N Farm Dr Unit L 97
- 170 Anderby Dr
- 170 Anderby Dr Unit L 99
- 372 N Farm Dr Unit L 96
- 136 Anderby Dr
- 335 North Farm Dr
- 148 Anderby Dr
- 148 Anderby Dr
- 148 Anderby Dr Unit L111
- 335 N Farm Dr
- 12 Cedar Grove Ct
- 317 North Farm Dr
- 163 Anderby Dr
- 163 Anderby Dr Unit L 110
- 135 Anderby Dr Unit L109
- 135 Anderby Dr