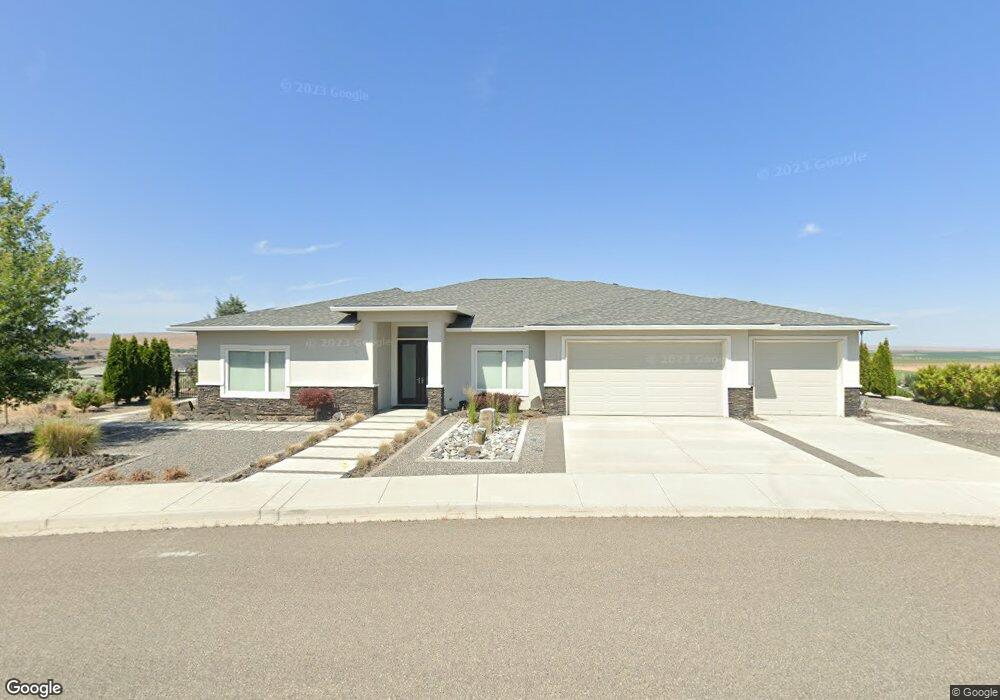
340 Northview Loop Unit CUSTOM HOME West Richland, WA 99353
Estimated Value: $777,516 - $909,000
4
Beds
3
Baths
2,446
Sq Ft
$345/Sq Ft
Est. Value
About This Home
This home is located at 340 Northview Loop Unit CUSTOM HOME, West Richland, WA 99353 and is currently estimated at $844,379, approximately $345 per square foot. 340 Northview Loop Unit CUSTOM HOME is a home located in Benton County with nearby schools including Tapteal Elementary School and Hanford High School.
Ownership History
Date
Name
Owned For
Owner Type
Purchase Details
Closed on
Oct 25, 2019
Sold by
Fischer John D and Fischer Sharon L
Bought by
Leong Linda S and Sien Peter K
Current Estimated Value
Purchase Details
Closed on
Dec 5, 2014
Sold by
Fischer Sharon L
Bought by
Fischer John D
Home Financials for this Owner
Home Financials are based on the most recent Mortgage that was taken out on this home.
Original Mortgage
$355,600
Interest Rate
3.89%
Mortgage Type
New Conventional
Purchase Details
Closed on
Dec 4, 2014
Sold by
Pischel Construction Llc
Bought by
Fischer John
Home Financials for this Owner
Home Financials are based on the most recent Mortgage that was taken out on this home.
Original Mortgage
$355,600
Interest Rate
3.89%
Mortgage Type
New Conventional
Purchase Details
Closed on
Jun 5, 2014
Sold by
Allied Activies Inc
Bought by
Pischel Construction Llc
Create a Home Valuation Report for This Property
The Home Valuation Report is an in-depth analysis detailing your home's value as well as a comparison with similar homes in the area
Home Values in the Area
Average Home Value in this Area
Purchase History
| Date | Buyer | Sale Price | Title Company |
|---|---|---|---|
| Leong Linda S | $668,954 | Ticor Title Co | |
| Fischer John D | -- | Frontier Title & Escrow Co | |
| Fischer John | $455,600 | Frontier Title & Escrow Co | |
| Pischel Construction Llc | $100,000 | Cascade Title |
Source: Public Records
Mortgage History
| Date | Status | Borrower | Loan Amount |
|---|---|---|---|
| Previous Owner | Fischer John D | $355,600 |
Source: Public Records
Tax History Compared to Growth
Tax History
| Year | Tax Paid | Tax Assessment Tax Assessment Total Assessment is a certain percentage of the fair market value that is determined by local assessors to be the total taxable value of land and additions on the property. | Land | Improvement |
|---|---|---|---|---|
| 2024 | $7,198 | $780,780 | $85,000 | $695,780 |
| 2023 | $7,198 | $679,190 | $85,000 | $594,190 |
| 2022 | $6,708 | $564,190 | $85,000 | $479,190 |
| 2021 | $5,531 | $545,020 | $85,000 | $460,020 |
| 2020 | $5,342 | $429,690 | $85,000 | $344,690 |
| 2019 | $4,917 | $398,350 | $85,000 | $313,350 |
| 2018 | $4,946 | $393,520 | $87,500 | $306,020 |
| 2017 | $4,402 | $342,520 | $87,500 | $255,020 |
| 2016 | $4,182 | $342,520 | $87,500 | $255,020 |
| 2015 | $1,258 | $342,520 | $87,500 | $255,020 |
| 2014 | -- | $100,800 | $100,800 | $0 |
| 2013 | -- | $100,800 | $100,800 | $0 |
Source: Public Records
Map
Nearby Homes
- 6334 Hove St
- 6530 Meyers St Unit 103
- 6408 Haag St
- 6631 Collins Rd
- 5120 Collins Rd
- 6630 Nelson St
- 6370 Cobalt Dr
- 104 N 68th Ave
- 5900 Everett St
- 6550 Cobalt Dr
- 302 Tumbleweed Ct
- 413 Bedrock Loop
- 5880 S 58th Ave
- 324 Mojave Ct
- 486 Bedrock Loop
- 6511 James St
- 201 N 69th Ave
- 6504 James St
- 503 Athens Dr
- 6806 James St
- 340 Northview Loop
- 348 Northview Loop
- 332 Northview Loop Unit Lot 3
- 323 Northview Loop
- 347 Northview Loop
- 347 Northview Loop Unit NEARING COMPLETION:
- 324 Northview Loop
- 6511 Sully Lane Prairie
- 371 Northview Loop
- 364 Northview Loop
- 6402 Westview Loop
- 6404 Westview Loop
- 6310 Westview Loop
- 383 Northview Loop
- 372 Northview Loop
- 372 Northview Loop Unit Stephen Recker Const
- 6308 Westview Loop
- 6406 Westview Loop
- 6406 Westview Loop Unit Ultra Modern Homes -
- 6406 Westview Loop Unit STUNNING VIEW!!! 201