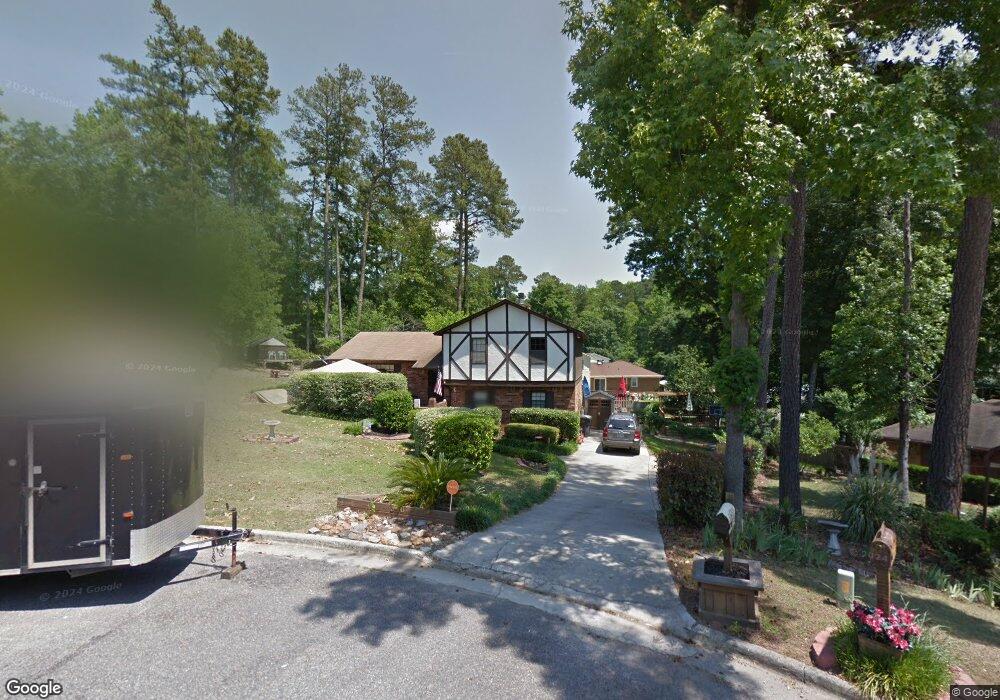
340 Oakleaf Ct Augusta, GA 30907
Estimated Value: $231,000 - $263,000
3
Beds
3
Baths
1,920
Sq Ft
$131/Sq Ft
Est. Value
About This Home
This home is located at 340 Oakleaf Ct, Augusta, GA 30907 and is currently estimated at $250,579, approximately $130 per square foot. 340 Oakleaf Ct is a home located in Columbia County with nearby schools including Westmont Elementary School, Columbia Middle School, and Evans High School.
Ownership History
Date
Name
Owned For
Owner Type
Purchase Details
Closed on
Nov 5, 2021
Sold by
Nesbitt David N
Bought by
Nesbitt Aubrey L
Current Estimated Value
Home Financials for this Owner
Home Financials are based on the most recent Mortgage that was taken out on this home.
Original Mortgage
$162,000
Outstanding Balance
$147,470
Interest Rate
2.99%
Mortgage Type
New Conventional
Estimated Equity
$103,109
Purchase Details
Closed on
Sep 17, 2004
Sold by
Lamp Charles Allen
Bought by
Lamp Charles Allen and Lamp Cindy
Home Financials for this Owner
Home Financials are based on the most recent Mortgage that was taken out on this home.
Original Mortgage
$123,000
Interest Rate
5.57%
Mortgage Type
New Conventional
Purchase Details
Closed on
Nov 9, 2001
Sold by
Wells Ella H
Bought by
Lamp Charles Allen
Home Financials for this Owner
Home Financials are based on the most recent Mortgage that was taken out on this home.
Original Mortgage
$120,258
Interest Rate
6.57%
Mortgage Type
VA
Create a Home Valuation Report for This Property
The Home Valuation Report is an in-depth analysis detailing your home's value as well as a comparison with similar homes in the area
Home Values in the Area
Average Home Value in this Area
Purchase History
| Date | Buyer | Sale Price | Title Company |
|---|---|---|---|
| Nesbitt Aubrey L | -- | -- | |
| Lamp Charles Allen | -- | -- | |
| Lamp Charles Allen | $117,900 | -- |
Source: Public Records
Mortgage History
| Date | Status | Borrower | Loan Amount |
|---|---|---|---|
| Open | Nesbitt Aubrey L | $162,000 | |
| Previous Owner | Lamp Charles Allen | $123,000 | |
| Previous Owner | Lamp Charles Allen | $120,258 |
Source: Public Records
Tax History
| Year | Tax Paid | Tax Assessment Tax Assessment Total Assessment is a certain percentage of the fair market value that is determined by local assessors to be the total taxable value of land and additions on the property. | Land | Improvement |
|---|---|---|---|---|
| 2025 | $2,418 | $100,877 | $16,644 | $84,233 |
| 2024 | $2,487 | $97,184 | $17,100 | $80,084 |
| 2023 | $2,487 | $79,374 | $12,444 | $66,930 |
| 2022 | $2,126 | $79,568 | $15,160 | $64,408 |
| 2021 | $1,944 | $69,326 | $12,929 | $56,397 |
| 2020 | $1,862 | $64,952 | $11,571 | $53,381 |
| 2019 | $1,701 | $59,138 | $9,631 | $49,507 |
| 2018 | $1,654 | $57,250 | $10,310 | $46,940 |
| 2017 | $1,646 | $56,768 | $10,019 | $46,749 |
| 2016 | $1,366 | $48,467 | $8,734 | $39,733 |
| 2015 | $1,406 | $49,887 | $8,637 | $41,250 |
| 2014 | $1,466 | $51,453 | $9,219 | $42,234 |
Source: Public Records
Map
Nearby Homes
- 319 Rockdale Rd
- 303 Meadowlake Dr
- 4518 Colonial Rd
- 289 Ashbrook Dr
- 606 Todd Rd
- 4507 Colonial Rd
- 4660 Millhaven Rd
- 706 Muscadine Ct
- 167 S Old Belair Rd
- 4524 Oakley Pirkle Rd
- 1447 Collins Dr
- 524 Casey Ct
- 4680 Oakley Pirkle Rd
- 5127 Parnell Way
- 213 S Belair Rd
- 443 S Old Belair Rd
- 2046 Magnolia Pkwy
- 133 Highview Dr
- 2037 Magnolia Pkwy
- 4009 Waccamaw Dr
- 340 Oak Leaf Ct
- 338 Oakleaf Ct
- 323 Oak Lake Dr
- 325 Oak Lake Dr
- 321 Oak Lake Dr
- 336 Oakleaf Ct
- 344 Oakleaf Ct
- 327 Oak Lake Dr
- 4569 Rockdale Ct
- 328 Oaklake Dr
- 324 Meadow Ct
- 322 Meadow Ct
- 346 Oakleaf Ct
- 319 Oak Lake Dr
- 324 Oak Lake Dr
- 326 Meadow Ct
- 326 Oak Lake Dr
- 317 Oak Lake Dr
- 322 Oak Lake Dr
- 329 Oak Lake Dr
Your Personal Tour Guide
Ask me questions while you tour the home.