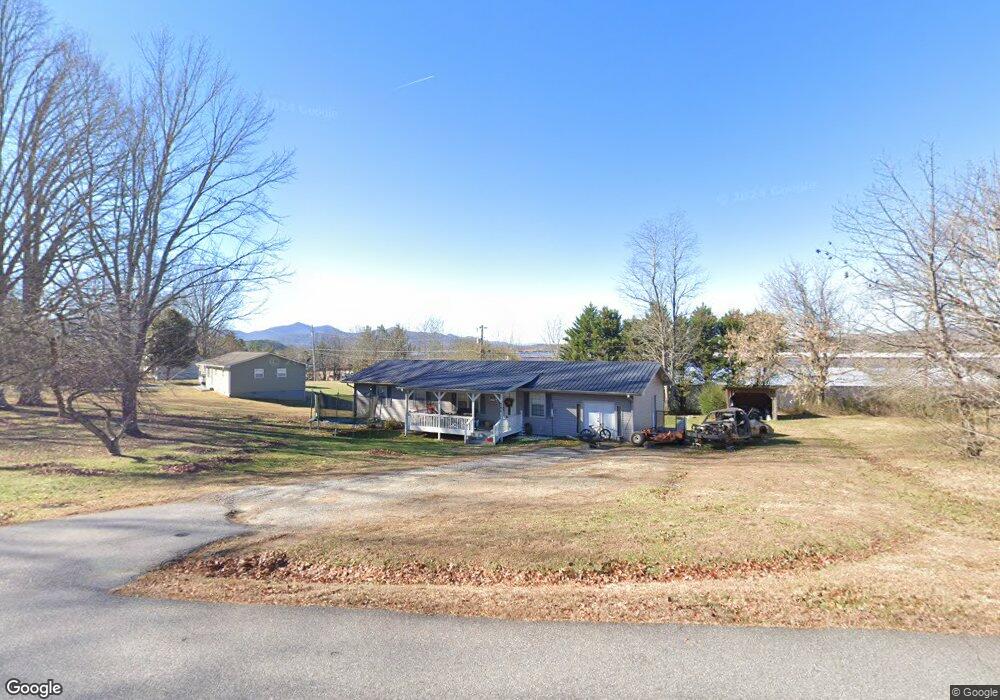
340 River Rd S Blairsville, GA 30512
Estimated Value: $273,075 - $302,000
3
Beds
2
Baths
1,420
Sq Ft
$200/Sq Ft
Est. Value
About This Home
This home is located at 340 River Rd S, Blairsville, GA 30512 and is currently estimated at $284,269, approximately $200 per square foot. 340 River Rd S is a home located in Union County with nearby schools including Union County Primary School, Union County Elementary School, and Union County Middle School.
Ownership History
Date
Name
Owned For
Owner Type
Purchase Details
Closed on
Sep 29, 2014
Sold by
Jarrett William C
Bought by
Brooks Michael L and Brooks Frankie D
Current Estimated Value
Home Financials for this Owner
Home Financials are based on the most recent Mortgage that was taken out on this home.
Original Mortgage
$123,469
Outstanding Balance
$94,865
Interest Rate
4.16%
Mortgage Type
New Conventional
Estimated Equity
$189,404
Purchase Details
Closed on
May 21, 2003
Sold by
King Brenda
Bought by
Jarrett William C and Jarrett Lois T
Purchase Details
Closed on
Jan 22, 2001
Sold by
Alexander Investment
Bought by
King Brenda
Purchase Details
Closed on
Dec 10, 1999
Sold by
Cash Larry D and Cash Sheil
Bought by
Alexander Investment
Purchase Details
Closed on
May 6, 1996
Bought by
Cash Larry D and Cash Sheil
Purchase Details
Closed on
Apr 22, 1994
Bought by
Jones Bonnie H and Jones Don
Create a Home Valuation Report for This Property
The Home Valuation Report is an in-depth analysis detailing your home's value as well as a comparison with similar homes in the area
Home Values in the Area
Average Home Value in this Area
Purchase History
| Date | Buyer | Sale Price | Title Company |
|---|---|---|---|
| Brooks Michael L | $116,500 | -- | |
| Jarrett William C | $80,000 | -- | |
| King Brenda | $62,000 | -- | |
| Alexander Investment | -- | -- | |
| Cash Larry D | $49,900 | -- | |
| Jones Bonnie H | -- | -- |
Source: Public Records
Mortgage History
| Date | Status | Borrower | Loan Amount |
|---|---|---|---|
| Open | Brooks Michael L | $123,469 |
Source: Public Records
Tax History Compared to Growth
Tax History
| Year | Tax Paid | Tax Assessment Tax Assessment Total Assessment is a certain percentage of the fair market value that is determined by local assessors to be the total taxable value of land and additions on the property. | Land | Improvement |
|---|---|---|---|---|
| 2024 | $938 | $81,396 | $4,400 | $76,996 |
| 2023 | $852 | $66,012 | $4,400 | $61,612 |
| 2022 | $695 | $54,240 | $4,400 | $49,840 |
| 2021 | $684 | $45,392 | $5,280 | $40,112 |
| 2020 | $644 | $36,039 | $5,312 | $30,727 |
| 2019 | $609 | $36,039 | $5,312 | $30,727 |
| 2018 | $633 | $36,039 | $5,312 | $30,727 |
| 2017 | $598 | $36,039 | $5,312 | $30,727 |
| 2016 | $677 | $40,537 | $5,312 | $35,225 |
| 2015 | $542 | $32,594 | $5,312 | $27,282 |
| 2013 | -- | $32,594 | $5,312 | $27,282 |
Source: Public Records
Map
Nearby Homes
- 436 River Rd S
- 19 Hickory Terrace
- 65 Lower River View Rd
- 1215 Blue Ridge Hwy
- 1609 Blue Ridge Hwy
- 1593 AND 1609 Blue Ridge Hwy
- LOT 56 Bryant Cove S D
- TR7 Arbor Farm Rd Unit TRACT 7
- LT 15 Red Tail Ln
- LT 44 Hidden Harbour
- LOT 14 Mile High Ln
- 0 Loving Dr Unit 10624678
- 1 Rachel Rd
- 0 Blue Ridge Hwy Unit 418722
- 0 Blue Ridge Hwy Unit A-2, C-1 10541532
- 0 Blue Ridge Hwy Unit 7596216
- 212 Golden Nugget Rd Unit LOT 39
- LOT 88 Thirteen Hundred
- LOT 16 Burnette Rd N
- 254 Golden Nugget Rd
- 304 River Rd S
- 378 River Rd S
- 323 River Rd S
- 1076 S River Rd
- 398 River Rd S
- 184 Hickory Heights Rd
- 175 Hickory Heights Rd
- 49 Thompson Ln
- LOT 2 River View Sub
- 252 River Rd S
- 265 River Rd S
- 153 Hickory Trail
- 0 River View Rd Unit 8393967
- 0 River View Rd Unit 9
- 0 River View Rd Unit 9014560
- 0 River View Rd Unit 9 8060472
- 0 River View Rd Unit 8181572
- 127 Hickory Heights Rd
- 214 River Rd S
- 965 S River Rd