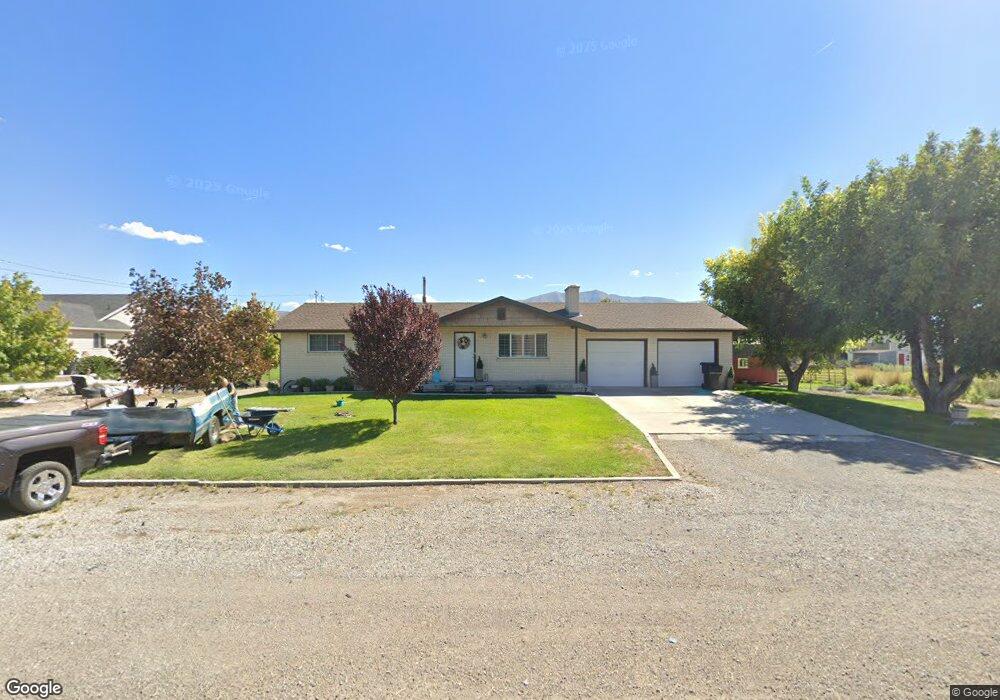
340 S 1000 W Tremonton, UT 84337
Estimated Value: $448,084 - $531,000
--
Bed
--
Bath
1,658
Sq Ft
$292/Sq Ft
Est. Value
About This Home
This home is located at 340 S 1000 W, Tremonton, UT 84337 and is currently estimated at $484,021, approximately $291 per square foot. 340 S 1000 W is a home located in Box Elder County with nearby schools including McKinley School, Alice C. Harris Intermediate School, and Bear River Middle School.
Ownership History
Date
Name
Owned For
Owner Type
Purchase Details
Closed on
Jan 16, 2013
Sold by
Jensen Steven K
Bought by
Jensen Steven Kent and The Jensen Family Trust
Current Estimated Value
Home Financials for this Owner
Home Financials are based on the most recent Mortgage that was taken out on this home.
Original Mortgage
$50,000
Outstanding Balance
$34,667
Interest Rate
3.31%
Mortgage Type
Credit Line Revolving
Estimated Equity
$449,354
Purchase Details
Closed on
Mar 6, 2007
Sold by
Jensen Steven Kent
Bought by
Jensen Steven Kent and Jensen Family Trust
Home Financials for this Owner
Home Financials are based on the most recent Mortgage that was taken out on this home.
Original Mortgage
$50,000
Interest Rate
6.23%
Mortgage Type
Credit Line Revolving
Create a Home Valuation Report for This Property
The Home Valuation Report is an in-depth analysis detailing your home's value as well as a comparison with similar homes in the area
Home Values in the Area
Average Home Value in this Area
Purchase History
| Date | Buyer | Sale Price | Title Company |
|---|---|---|---|
| Jensen Steven Kent | -- | Elder Land Title Co | |
| Jensen Steven K | -- | Box Elder Land Title Co | |
| Jensen Steven Kent | -- | None Available | |
| Jensen Steven Kent | -- | None Available |
Source: Public Records
Mortgage History
| Date | Status | Borrower | Loan Amount |
|---|---|---|---|
| Open | Jensen Steven Kent | $50,000 | |
| Closed | Jensen Steven Kent | $50,000 |
Source: Public Records
Tax History Compared to Growth
Tax History
| Year | Tax Paid | Tax Assessment Tax Assessment Total Assessment is a certain percentage of the fair market value that is determined by local assessors to be the total taxable value of land and additions on the property. | Land | Improvement |
|---|---|---|---|---|
| 2025 | $2,784 | $456,889 | $115,000 | $341,889 |
| 2024 | $2,784 | $461,347 | $115,000 | $346,347 |
| 2023 | $2,884 | $471,642 | $110,000 | $361,642 |
| 2022 | $2,504 | $233,742 | $24,750 | $208,992 |
| 2021 | $2,254 | $289,389 | $45,000 | $244,389 |
| 2020 | $1,979 | $289,389 | $45,000 | $244,389 |
| 2019 | $1,867 | $134,517 | $24,750 | $109,767 |
| 2018 | $1,553 | $116,521 | $16,500 | $100,021 |
| 2017 | $1,604 | $199,167 | $16,500 | $169,167 |
| 2016 | $1,586 | $112,497 | $16,500 | $95,997 |
| 2015 | $461 | $105,179 | $16,500 | $88,679 |
| 2014 | $461 | $32,016 | $16,500 | $15,516 |
| 2013 | -- | $86,186 | $11,470 | $74,716 |
Source: Public Records
Map
Nearby Homes