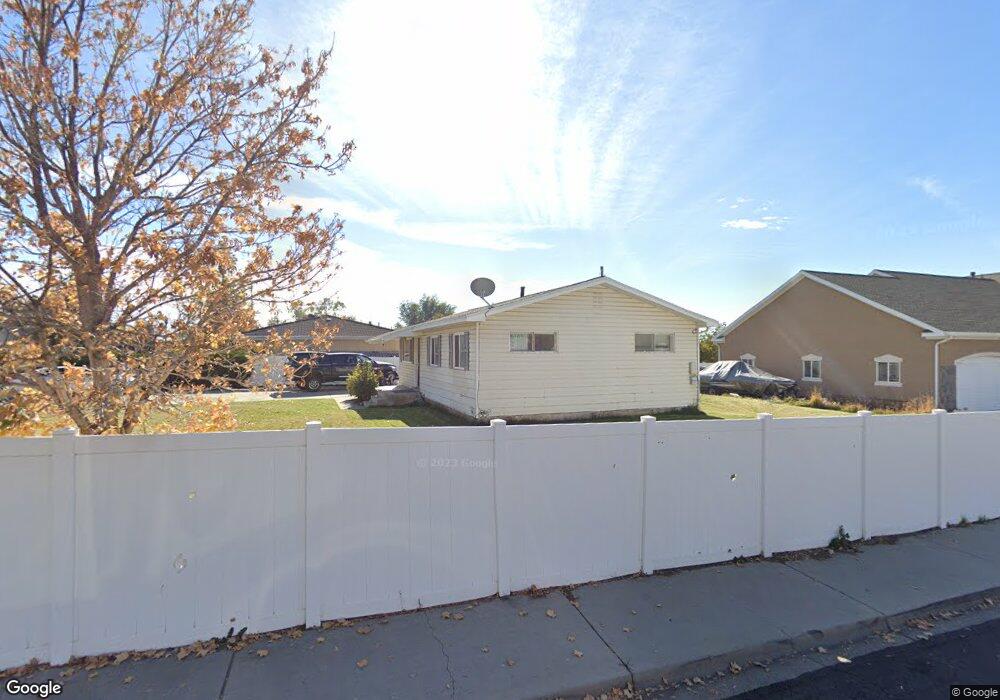
340 S 800 W Orem, UT 84058
Orem Park NeighborhoodEstimated Value: $398,000 - $510,000
3
Beds
3
Baths
1,000
Sq Ft
$457/Sq Ft
Est. Value
About This Home
This home is located at 340 S 800 W, Orem, UT 84058 and is currently estimated at $457,364, approximately $457 per square foot. 340 S 800 W is a home with nearby schools including Orem Elementary School, Orem Junior High School, and Mountain View High School.
Ownership History
Date
Name
Owned For
Owner Type
Purchase Details
Closed on
Oct 13, 2016
Sold by
Roseman Dustin G and Roseman Stephanie
Bought by
Nielson Andrew and The 491 Trust
Current Estimated Value
Home Financials for this Owner
Home Financials are based on the most recent Mortgage that was taken out on this home.
Original Mortgage
$95,000
Interest Rate
3.46%
Mortgage Type
Purchase Money Mortgage
Purchase Details
Closed on
Aug 2, 2011
Sold by
Nielson Andrew
Bought by
Aj Resources Lc
Create a Home Valuation Report for This Property
The Home Valuation Report is an in-depth analysis detailing your home's value as well as a comparison with similar homes in the area
Home Values in the Area
Average Home Value in this Area
Purchase History
| Date | Buyer | Sale Price | Title Company |
|---|---|---|---|
| Nielson Andrew | -- | Integrated Title Ins Svcs | |
| Aj Resources Lc | -- | None Available |
Source: Public Records
Mortgage History
| Date | Status | Borrower | Loan Amount |
|---|---|---|---|
| Closed | Nielson Andrew | $95,000 |
Source: Public Records
Tax History
| Year | Tax Paid | Tax Assessment Tax Assessment Total Assessment is a certain percentage of the fair market value that is determined by local assessors to be the total taxable value of land and additions on the property. | Land | Improvement |
|---|---|---|---|---|
| 2025 | $1,451 | $196,130 | -- | -- |
| 2024 | $1,451 | $177,485 | $0 | $0 |
| 2023 | $1,321 | $173,635 | $0 | $0 |
| 2022 | $1,776 | $226,105 | $0 | $0 |
| 2021 | $1,651 | $318,400 | $176,400 | $142,000 |
| 2020 | $1,479 | $280,300 | $141,100 | $139,200 |
| 2019 | $1,308 | $257,700 | $130,200 | $127,500 |
| 2018 | $1,211 | $228,000 | $112,100 | $115,900 |
| 2017 | $1,110 | $111,980 | $0 | $0 |
| 2016 | $1,050 | $97,680 | $0 | $0 |
| 2015 | $1,075 | $94,545 | $0 | $0 |
| 2014 | $1,061 | $92,950 | $0 | $0 |
Source: Public Records
Map
Nearby Homes
- 288 S 800 W
- 935 W 360 S
- 506 S 800 West St Unit 13
- 520 S 800 W Unit 14
- 570 S 800 West St Unit 15
- 237 S Ridgeview Dr
- 1041 W 600 S
- 896 W 30 S
- 155 S 1200 W Unit 69
- 155 S 1200 W Unit 6
- 155 S 1200 W Unit 97
- 278 S 1160 W
- 350 S 1200 W Unit 2
- 216 S 400 W
- 45 N 970 W
- 565 W 40 N
- 508 W 40 N
- 1110 W 105 N
- 64 S 320 W
- 302 W 100 S
Your Personal Tour Guide
Ask me questions while you tour the home.