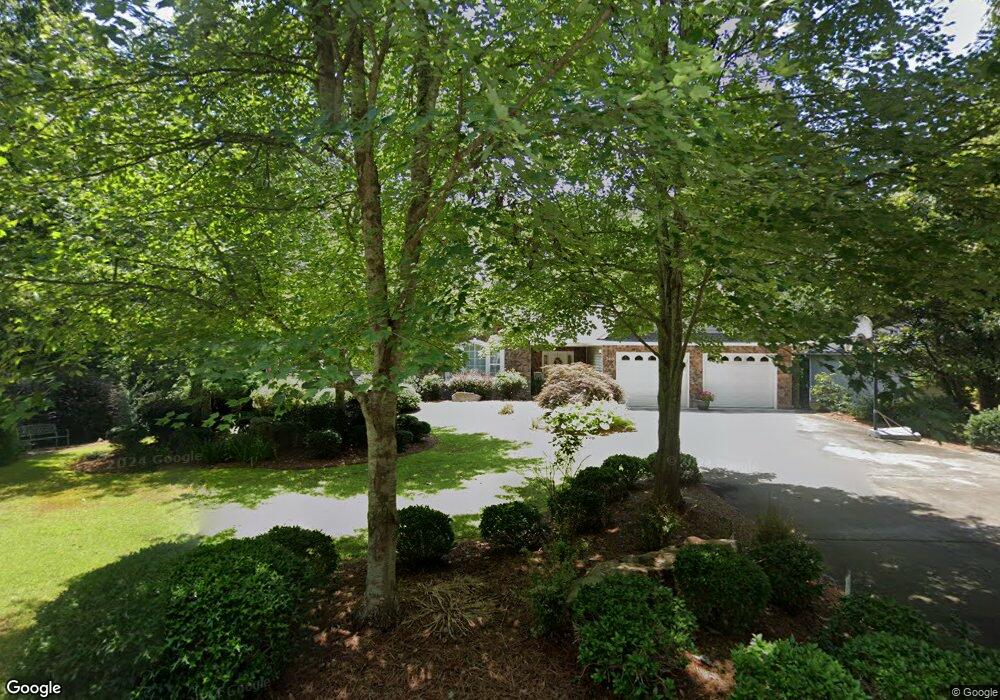
340 Sally Cir Ellijay, GA 30536
Estimated Value: $454,727 - $564,000
--
Bed
2
Baths
2,046
Sq Ft
$244/Sq Ft
Est. Value
About This Home
This home is located at 340 Sally Cir, Ellijay, GA 30536 and is currently estimated at $499,932, approximately $244 per square foot. 340 Sally Cir is a home located in Gilmer County with nearby schools including Ellijay Elementary School, Clear Creek Elementary School, and Clear Creek Middle School.
Ownership History
Date
Name
Owned For
Owner Type
Purchase Details
Closed on
Oct 16, 2025
Sold by
Sams Dianne H
Bought by
Sams Diane Harper Rev Trust and Sams Diane Harper
Current Estimated Value
Purchase Details
Closed on
Mar 5, 2008
Sold by
Whitener Donna R
Bought by
Sams Dianne H
Home Financials for this Owner
Home Financials are based on the most recent Mortgage that was taken out on this home.
Original Mortgage
$240,476
Interest Rate
5.62%
Mortgage Type
New Conventional
Purchase Details
Closed on
Mar 11, 2002
Sold by
Waters James F and Waters Vic
Bought by
Whitener Donna R
Purchase Details
Closed on
Aug 28, 2000
Sold by
Hensley Terry
Bought by
Waters James F and Waters Vic
Purchase Details
Closed on
Jan 26, 1999
Sold by
Adams Brandy and Adams Lozano
Bought by
Hensley Terry
Purchase Details
Closed on
Aug 1, 1998
Sold by
Anderson John P
Bought by
Adams Brandy and Adams Lozan
Purchase Details
Closed on
Apr 1, 1997
Bought by
Adams Brandy and Adams Lozan
Create a Home Valuation Report for This Property
The Home Valuation Report is an in-depth analysis detailing your home's value as well as a comparison with similar homes in the area
Home Values in the Area
Average Home Value in this Area
Purchase History
| Date | Buyer | Sale Price | Title Company |
|---|---|---|---|
| Sams Diane Harper Rev Trust | -- | -- | |
| Sams Dianne H | $209,674 | -- | |
| Whitener Donna R | $215,000 | -- | |
| Waters James F | $18,000 | -- | |
| Hensley Terry | $54,000 | -- | |
| Adams Brandy | $56,000 | -- | |
| Adams Brandy | $35,000 | -- |
Source: Public Records
Mortgage History
| Date | Status | Borrower | Loan Amount |
|---|---|---|---|
| Previous Owner | Sams Dianne H | $240,476 |
Source: Public Records
Tax History Compared to Growth
Tax History
| Year | Tax Paid | Tax Assessment Tax Assessment Total Assessment is a certain percentage of the fair market value that is determined by local assessors to be the total taxable value of land and additions on the property. | Land | Improvement |
|---|---|---|---|---|
| 2025 | -- | $173,200 | $6,240 | $166,960 |
| 2024 | -- | $171,680 | $6,240 | $165,440 |
| 2023 | $654 | $171,680 | $6,240 | $165,440 |
| 2022 | $678 | $140,120 | $5,200 | $134,920 |
| 2021 | $753 | $114,960 | $6,960 | $108,000 |
| 2020 | $2,331 | $105,960 | $9,360 | $96,600 |
| 2019 | $342 | $100,760 | $4,160 | $96,600 |
| 2018 | $300 | $101,800 | $5,200 | $96,600 |
| 2017 | $74 | $81,880 | $5,200 | $76,680 |
| 2016 | $162 | $83,520 | $6,000 | $77,520 |
| 2015 | $127 | $76,960 | $6,000 | $70,960 |
| 2014 | $58 | $69,800 | $6,000 | $63,800 |
| 2013 | -- | $71,720 | $6,000 | $65,720 |
Source: Public Records
Map
Nearby Homes
- 220 Oak Ridge Ln
- LOT 6 Riverfront Dr
- LOT 3 Riverfront Dr
- LOT 4 Riverfront Dr
- LOT 5 Riverfront Dr
- 0 Aspen Ave Unit 10501189
- 0 Aspen Ave Unit 1025047
- 0 Yukon Rd Unit 10649657
- LOT 17 Misty Mountain Trail
- LOT 3 Ridgehaven Trail
- Lots 1-3 Ridgehaven Trail
- 0 Holly Berry Ct
- 269 Old Orchard Rd
- 71 Black Walnut Place
- 0 Highway 52 W Unit 10598315
- 0 Highway 52 W Unit 7642027
- 00 Yukon Rd
- 308 Sally Cir
- 392 Sally Cir
- 341 Sally Cir
- 260 Sally Cir
- 297 Sally Cir
- 297 Sally Cir Unit 145
- 224 Sally Cir
- LT149 Sally Cir
- 0 Sally Cir Unit LT. 136 9066898
- LT. 136 Sally Cir Unit 136
- 136 Sally Cir
- 0 Sally Cir Unit 8853967
- 0 Sally Cir Unit LT 149 8627337
- 0 Sally Cir Unit LT 149
- 285 Sally Cir
- 418 Sally Cir
- 220 Oakridge Ln
- 149 Oakridge Ln
- 438 Sally Cir
- 412 Sally Cir