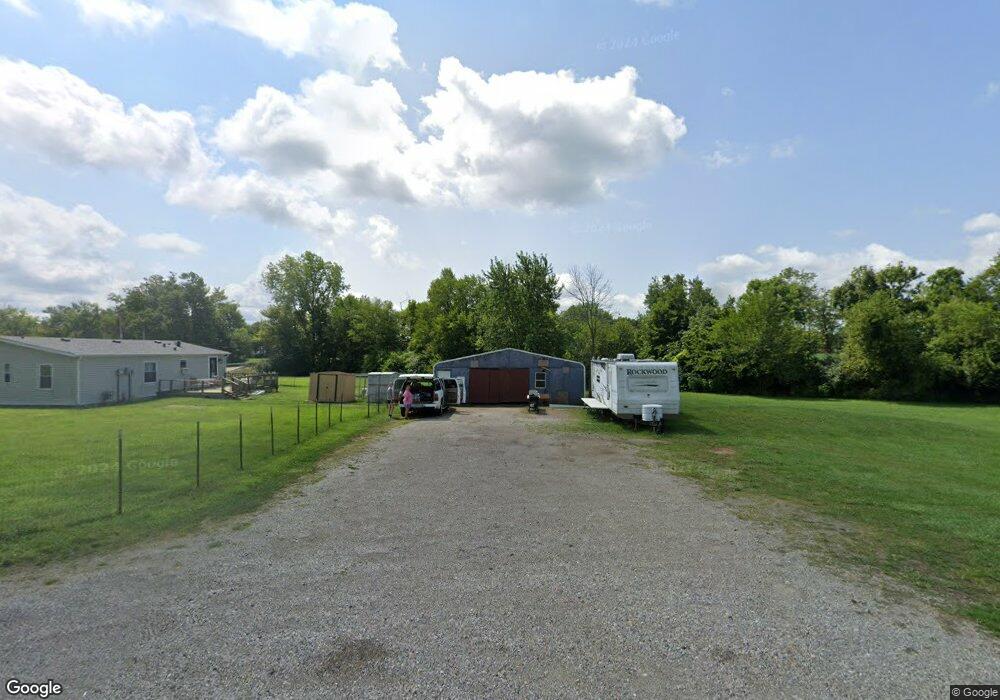
340 Sample Rd West Alexandria, OH 45381
Estimated Value: $169,000 - $210,000
3
Beds
2
Baths
1,134
Sq Ft
$174/Sq Ft
Est. Value
About This Home
This home is located at 340 Sample Rd, West Alexandria, OH 45381 and is currently estimated at $197,318, approximately $174 per square foot. 340 Sample Rd is a home located in Preble County with nearby schools including Twin Valley South Elementary School, Twin Valley South Middle School, and Twin Valley South High School.
Ownership History
Date
Name
Owned For
Owner Type
Purchase Details
Closed on
Oct 21, 2011
Sold by
Thompson Linda L and Thompson Timothy E
Bought by
Tinell Pennie L
Current Estimated Value
Purchase Details
Closed on
Jan 25, 2005
Sold by
Abn Amro Mortgage Group Inc
Bought by
Thompson Linda L
Home Financials for this Owner
Home Financials are based on the most recent Mortgage that was taken out on this home.
Original Mortgage
$55,200
Interest Rate
5.71%
Mortgage Type
Purchase Money Mortgage
Purchase Details
Closed on
Jul 16, 2004
Sold by
Federal Home Loan Mortgage Corporation
Bought by
Abn Amro Mortgage Group Inc
Purchase Details
Closed on
Mar 19, 1998
Sold by
Withrow Janet F
Bought by
Palm Harbor Homes
Purchase Details
Closed on
Oct 27, 1986
Bought by
Tinell Pennie L
Create a Home Valuation Report for This Property
The Home Valuation Report is an in-depth analysis detailing your home's value as well as a comparison with similar homes in the area
Home Values in the Area
Average Home Value in this Area
Purchase History
| Date | Buyer | Sale Price | Title Company |
|---|---|---|---|
| Tinell Pennie L | $80,000 | Performance Title | |
| Thompson Linda L | $69,000 | Resource Title Agency Inc | |
| Abn Amro Mortgage Group Inc | $10,000 | Resource Title Agency Inc | |
| Palm Harbor Homes | $12,500 | -- | |
| Tinell Pennie L | $1,500 | -- |
Source: Public Records
Mortgage History
| Date | Status | Borrower | Loan Amount |
|---|---|---|---|
| Previous Owner | Thompson Linda L | $55,200 |
Source: Public Records
Tax History Compared to Growth
Tax History
| Year | Tax Paid | Tax Assessment Tax Assessment Total Assessment is a certain percentage of the fair market value that is determined by local assessors to be the total taxable value of land and additions on the property. | Land | Improvement |
|---|---|---|---|---|
| 2024 | $1,578 | $44,380 | $13,860 | $30,520 |
| 2023 | $1,578 | $44,380 | $13,860 | $30,520 |
| 2022 | $1,323 | $34,970 | $12,920 | $22,050 |
| 2021 | $1,431 | $34,970 | $12,920 | $22,050 |
| 2020 | $1,372 | $34,970 | $12,920 | $22,050 |
| 2019 | $1,173 | $28,950 | $10,780 | $18,170 |
| 2018 | $1,212 | $28,950 | $10,780 | $18,170 |
| 2017 | $1,110 | $28,950 | $10,780 | $18,170 |
| 2016 | $1,074 | $28,280 | $10,500 | $17,780 |
| 2014 | $583 | $28,280 | $10,500 | $17,780 |
| 2013 | $583 | $28,735 | $10,500 | $18,235 |
Source: Public Records
Map
Nearby Homes
- 250 Yost Rd
- 3659 Winston Ln
- 1389 Leon Dr
- 10 Western Dr
- 99 Katherine Dr
- 86 Snapdragon Dr
- The Heath House Plan at Meadowbrook Estates
- The Aspen House Plan at Meadowbrook Estates
- The Reed II House Plan at Meadowbrook Estates
- The Rowan House Plan at Meadowbrook Estates
- The Linden House Plan at Meadowbrook Estates
- The Sequoia House Plan at Meadowbrook Estates
- 232 Goldenrod Dr
- 37 Smith St
- 60 Hope Ave
- 4801 Fisher Twin Rd
- 0 U S 35
- 124 Wynona Dr
- 36 E 3rd St
- 212 E 3rd St
- 245 Quaker Trace Rd
- 344 Quaker Trace Rd
- 345 Sample Dr
- 345 Sample Rd
- 331 Sample Rd
- 225 Quaker Trace Rd
- 192 Quaker Trace Rd
- 303 Sample Rd
- 358 Quaker Trace Rd
- 207 Quaker Trace Rd
- 305 Sample Rd
- 187 Quaker Trace Rd
- 378 Quaker Trace Rd
- 180 Quaker Trace Rd
- 236 Sample Rd
- 315 Quaker Trace Rd
- 175 Quaker Trace Rd
- 380 Quaker Trace Rd
- 222 Sample Rd
- 198 Sample Rd