Estimated Value: $819,977 - $920,000
4
Beds
5
Baths
5,730
Sq Ft
$154/Sq Ft
Est. Value
About This Home
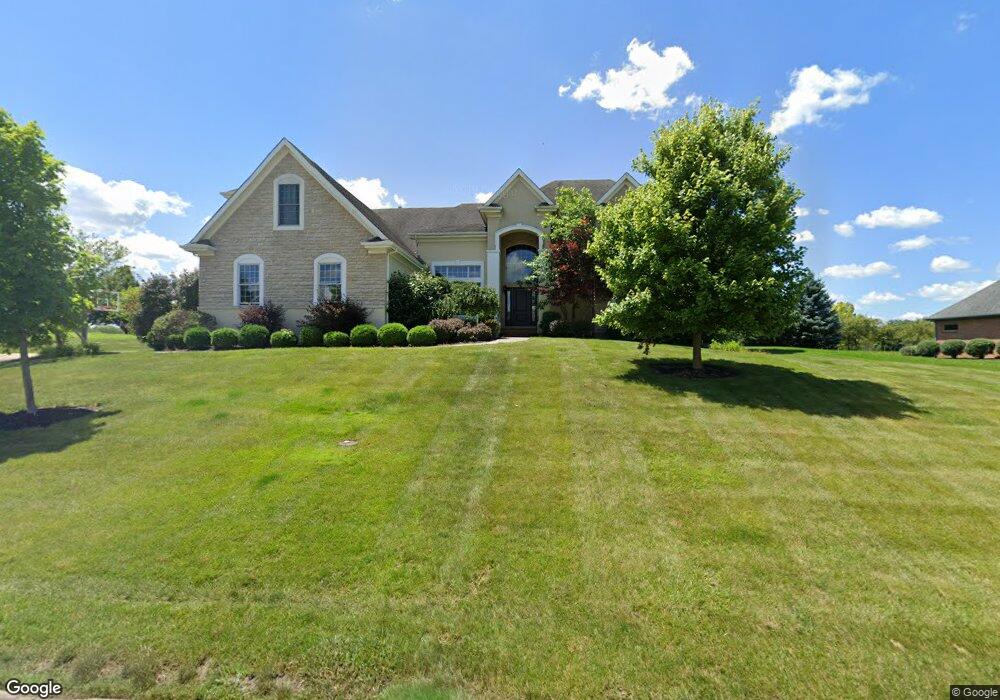
This home is located at 340 Signature Dr S, Xenia, OH 45385 and is currently estimated at $881,992, approximately $153 per square foot. 340 Signature Dr S is a home located in Greene County with nearby schools including Trebein Elementary School, Jacob Coy Middle School, and Beavercreek High School.
Ownership History
Date
Name
Owned For
Owner Type
Purchase Details
Closed on
Sep 24, 2008
Sold by
Harlow Gregory B and Harlow April K
Bought by
Ajlouni Sayyah and Dakalbab Eiman
Current Estimated Value
Home Financials for this Owner
Home Financials are based on the most recent Mortgage that was taken out on this home.
Original Mortgage
$417,000
Outstanding Balance
$278,491
Interest Rate
6.52%
Mortgage Type
Unknown
Estimated Equity
$603,501
Purchase Details
Closed on
Sep 15, 2003
Sold by
Capital Golf Management Llc
Bought by
Harlow Gregory B
Purchase Details
Closed on
Aug 12, 2003
Sold by
Nbl Development Group Lp
Bought by
Capital Golf Management Llc
Create a Home Valuation Report for This Property
The Home Valuation Report is an in-depth analysis detailing your home's value as well as a comparison with similar homes in the area
Home Values in the Area
Average Home Value in this Area
Purchase History
| Date | Buyer | Sale Price | Title Company |
|---|---|---|---|
| Ajlouni Sayyah | $552,000 | None Available | |
| Harlow Gregory B | $180,000 | -- | |
| Capital Golf Management Llc | -- | -- |
Source: Public Records
Mortgage History
| Date | Status | Borrower | Loan Amount |
|---|---|---|---|
| Open | Ajlouni Sayyah | $417,000 |
Source: Public Records
Tax History Compared to Growth
Tax History
| Year | Tax Paid | Tax Assessment Tax Assessment Total Assessment is a certain percentage of the fair market value that is determined by local assessors to be the total taxable value of land and additions on the property. | Land | Improvement |
|---|---|---|---|---|
| 2024 | $13,766 | $239,690 | $29,650 | $210,040 |
| 2023 | $13,766 | $239,690 | $29,650 | $210,040 |
| 2022 | $13,676 | $208,790 | $29,650 | $179,140 |
| 2021 | $13,813 | $208,790 | $29,650 | $179,140 |
| 2020 | $13,879 | $208,790 | $29,650 | $179,140 |
| 2019 | $13,904 | $192,090 | $22,960 | $169,130 |
| 2018 | $12,157 | $192,090 | $22,960 | $169,130 |
| 2017 | $11,930 | $192,090 | $22,960 | $169,130 |
| 2016 | $11,817 | $184,130 | $22,960 | $161,170 |
| 2015 | $11,891 | $184,130 | $22,960 | $161,170 |
| 2014 | $11,622 | $184,130 | $22,960 | $161,170 |
Source: Public Records
Map
Nearby Homes
- 463 Valhalla Ct
- 295 Stratford Ln
- 185 Barrington Village Dr
- 131 Ridgebrook Trail
- 2284 Annandale Place
- 153 George Wythe Way
- 90 Pawleys Plantation Ct
- 29 Governors Club Dr
- 33 Governors Club Dr
- 2176 Meridian Ct
- 2580 Paydon Randoff Rd
- 705 Memorial Dr
- 3109 Indian Ripple Rd
- 179 Honey Jane Dr
- 264 S Alpha Bellbrook Rd
- 79.4 acres Valley Springs Rd
- Cheswicke Plan at Sky Crossing
- Barrett Plan at Sky Crossing
- Nicholas Plan at Sky Crossing
- Hampton Plan at Sky Crossing
- 347 Signature Dr S
- 328 Signature Dr S
- 352 Signature Dr S
- 327 Signature Dr S
- 316 Signature Dr S
- 370 Signature Dr S
- 0 Signature Dr S Unit 107 393054
- 0 Signature Dr S Unit 103 393048
- 2565 Glen Abbey Place
- 304 Signature Dr S
- 195 Castle Pine Ct
- 2584 Glen Abbey Place
- 200 Castle Pine Ct
- 375 Signature Dr S
- 305 Signature Dr S
- 292 Signature Dr S
- 292 Signature Dr S Unit Beavercreek
- 2547 Glen Abbey Place
- 2564 Glen Abbey Place
- 190 Castle Pine Ct