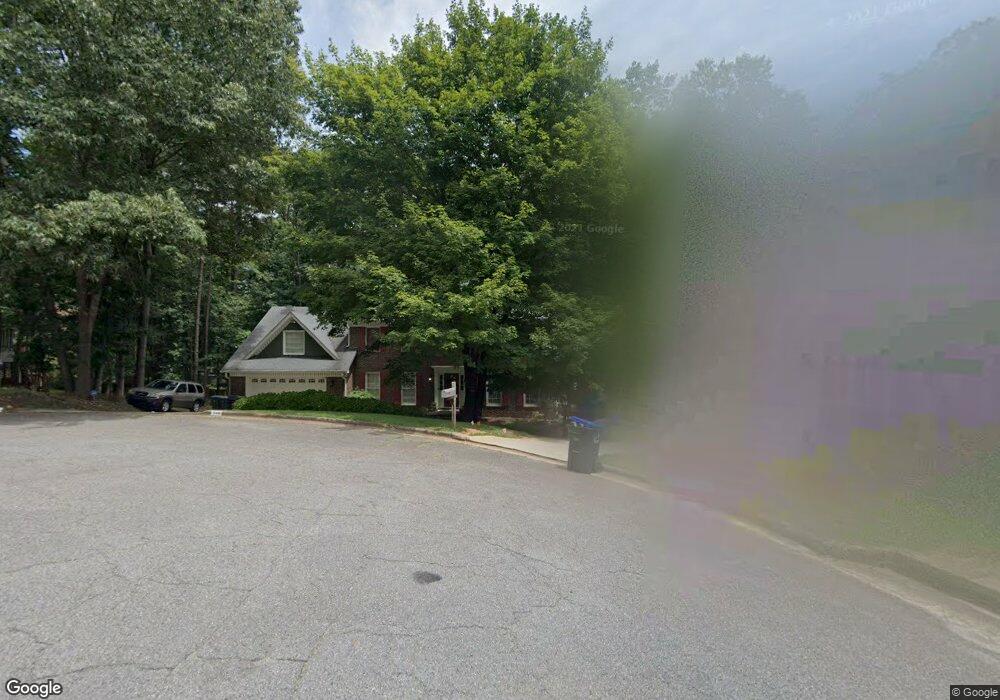
340 Spindletree Trace Roswell, GA 30076
Estimated Value: $622,000 - $655,000
4
Beds
3
Baths
2,742
Sq Ft
$233/Sq Ft
Est. Value
About This Home
This home is located at 340 Spindletree Trace, Roswell, GA 30076 and is currently estimated at $638,778, approximately $232 per square foot. 340 Spindletree Trace is a home located in Fulton County with nearby schools including River Eves Elementary School, Holcomb Bridge Middle School, and Centennial High School.
Ownership History
Date
Name
Owned For
Owner Type
Purchase Details
Closed on
Oct 15, 2004
Sold by
Land 340 Spindletree Trace
Bought by
Holsworth Lee A and Holsworth Cynthia
Current Estimated Value
Home Financials for this Owner
Home Financials are based on the most recent Mortgage that was taken out on this home.
Original Mortgage
$310,000
Interest Rate
5.74%
Mortgage Type
New Conventional
Purchase Details
Closed on
Jun 8, 2004
Sold by
Holsworth Cynthia C and Holsworth Lee A
Bought by
Unto Freeport Title & Guaranty
Purchase Details
Closed on
May 22, 1998
Sold by
Taylor Josef M and Taylor Kimilee D
Bought by
Lojek Alfred S and Lojek Barbara L
Home Financials for this Owner
Home Financials are based on the most recent Mortgage that was taken out on this home.
Original Mortgage
$84,500
Interest Rate
7.11%
Mortgage Type
New Conventional
Create a Home Valuation Report for This Property
The Home Valuation Report is an in-depth analysis detailing your home's value as well as a comparison with similar homes in the area
Home Values in the Area
Average Home Value in this Area
Purchase History
| Date | Buyer | Sale Price | Title Company |
|---|---|---|---|
| Holsworth Lee A | -- | -- | |
| Unto Freeport Title & Guaranty | -- | -- | |
| Lojek Alfred S | $153,000 | -- |
Source: Public Records
Mortgage History
| Date | Status | Borrower | Loan Amount |
|---|---|---|---|
| Previous Owner | Holsworth Lee A | $310,000 | |
| Previous Owner | Lojek Alfred S | $84,500 |
Source: Public Records
Tax History Compared to Growth
Tax History
| Year | Tax Paid | Tax Assessment Tax Assessment Total Assessment is a certain percentage of the fair market value that is determined by local assessors to be the total taxable value of land and additions on the property. | Land | Improvement |
|---|---|---|---|---|
| 2025 | $660 | $222,160 | $50,480 | $171,680 |
| 2023 | $5,914 | $209,520 | $68,760 | $140,760 |
| 2022 | $2,978 | $185,600 | $41,840 | $143,760 |
| 2021 | $3,470 | $158,800 | $35,240 | $123,560 |
| 2020 | $3,534 | $156,920 | $34,800 | $122,120 |
| 2019 | $514 | $145,200 | $33,160 | $112,040 |
| 2018 | $3,661 | $141,800 | $32,400 | $109,400 |
| 2017 | $2,491 | $97,320 | $22,240 | $75,080 |
| 2016 | $2,490 | $97,320 | $22,240 | $75,080 |
| 2015 | $3,030 | $97,320 | $22,240 | $75,080 |
| 2014 | $2,593 | $97,320 | $22,240 | $75,080 |
Source: Public Records
Map
Nearby Homes
- 110 River Terrace Point
- 1820 Branch Valley Dr
- 680 Branch Valley Ct
- 9156 Branch Valley Way
- 140 Glen Holly Dr
- 3040 Gray Hawk Ln
- 3209 Canyon Point Cir
- 1115 Canyon Point Cir
- 920 Renaissance Way
- 1985 Branch Valley Dr
- 3001 Canyon Point Cir
- 945 Club Chase Ct
- 8320 Sentinae Chase Dr
- 263 Quail Run
- 230 Winterberry Ct
- 225 Winterberry Ct
- 311 Quail Run
- 309 Quail Run
- 227 Quail Run
- 4040 Declaration Dr
- 330 Spindletree Trace
- 350 Spindletree Trace
- 9133 Branch Valley Way
- 320 Spindletree Trace Unit 2
- 405 Bellflower Ct
- 9135 Branch Valley Way
- 415 Bellflower Ct
- 9137 Branch Valley Way
- 370 Spindletree Trace
- 370 Spindletree Trace Unit 10
- 365 Spindletree Trace
- 360 Spindletree Trace
- 355 Spindletree Trace
- 325 Spindletree Trace Unit 2
- 345 Spindletree Trace
- 335 Spindletree Trace Unit 2
- 9136 Branch Valley Way
- 310 Spindletree Trace
- 505 Bellfield Ct Unit 3
- 400 Bellflower Ct