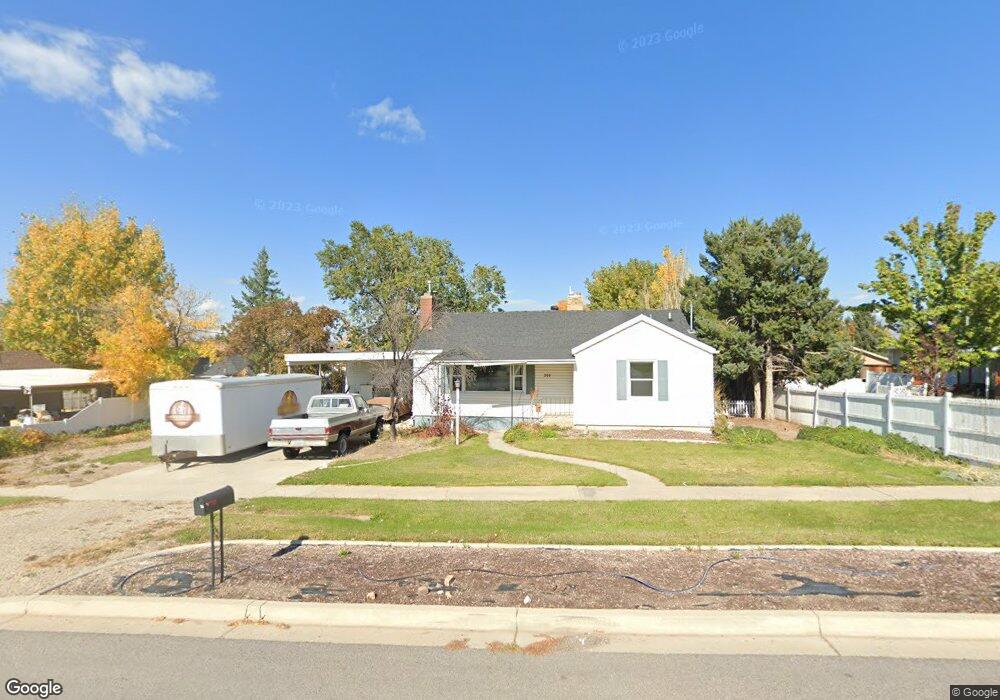
340 W 400 S Payson, UT 84651
Estimated Value: $406,000 - $448,000
2
Beds
3
Baths
1,056
Sq Ft
$407/Sq Ft
Est. Value
About This Home
This home is located at 340 W 400 S, Payson, UT 84651 and is currently estimated at $429,266, approximately $406 per square foot. 340 W 400 S is a home located in Utah County with nearby schools including Wilson Elementary School, Mt. Nebo Middle, and Payson Junior High School.
Ownership History
Date
Name
Owned For
Owner Type
Purchase Details
Closed on
Jun 30, 2018
Sold by
Olson Ernest Garth and Olson Kevin Williams
Bought by
Dalley Lance David and Dalley Kristi Kyle
Current Estimated Value
Home Financials for this Owner
Home Financials are based on the most recent Mortgage that was taken out on this home.
Original Mortgage
$199,500
Outstanding Balance
$172,897
Interest Rate
4.5%
Mortgage Type
New Conventional
Estimated Equity
$256,369
Purchase Details
Closed on
May 28, 2010
Sold by
Olson Mildred W and Olson Mildred
Bought by
Olson Mildred W and Olson Ernest Garth
Create a Home Valuation Report for This Property
The Home Valuation Report is an in-depth analysis detailing your home's value as well as a comparison with similar homes in the area
Home Values in the Area
Average Home Value in this Area
Purchase History
| Date | Buyer | Sale Price | Title Company |
|---|---|---|---|
| Dalley Lance David | -- | Gt Title Services | |
| Olson Mildred W | -- | Provo Land Title Company |
Source: Public Records
Mortgage History
| Date | Status | Borrower | Loan Amount |
|---|---|---|---|
| Open | Dalley Lance David | $199,500 |
Source: Public Records
Tax History
| Year | Tax Paid | Tax Assessment Tax Assessment Total Assessment is a certain percentage of the fair market value that is determined by local assessors to be the total taxable value of land and additions on the property. | Land | Improvement |
|---|---|---|---|---|
| 2025 | $1,903 | $228,250 | -- | -- |
| 2024 | $1,903 | $193,655 | $0 | $0 |
| 2023 | $1,822 | $185,900 | $0 | $0 |
| 2022 | $1,746 | $175,285 | $0 | $0 |
| 2021 | $1,466 | $236,000 | $96,400 | $139,600 |
| 2020 | $1,362 | $214,500 | $83,800 | $130,700 |
| 2019 | $1,161 | $187,400 | $72,400 | $115,000 |
| 2018 | $1,130 | $175,900 | $60,900 | $115,000 |
| 2017 | $1,042 | $87,230 | $0 | $0 |
| 2016 | $1,014 | $84,315 | $0 | $0 |
| 2015 | $974 | $80,410 | $0 | $0 |
| 2014 | $858 | $71,390 | $0 | $0 |
Source: Public Records
Map
Nearby Homes
- 128 S 300 W
- 116 S 300 W
- 549 S Main St
- 1836 S 100 E
- 533 S 700 W
- 116 E 100 S
- 742 W 400 S
- 588 W Utah Ave
- 252 S 400 E
- 229 E 670 S Unit 7
- 118 E 100 N
- 252 E 670 S Unit 2
- 626 S 800 W Unit 32
- 195 W 300 N
- 221 S Majestic Meadows Dr
- 225 S Majestic Meadows Dr
- 227 S Majestic Meadows Dr
- 420 E 600 S
- 1287 N 1390 E Unit 25-96
- 815 S Canyon Rd
Your Personal Tour Guide
Ask me questions while you tour the home.