Estimated Value: $1,021,000 - $1,255,401
4
Beds
3
Baths
2,982
Sq Ft
$367/Sq Ft
Est. Value
About This Home
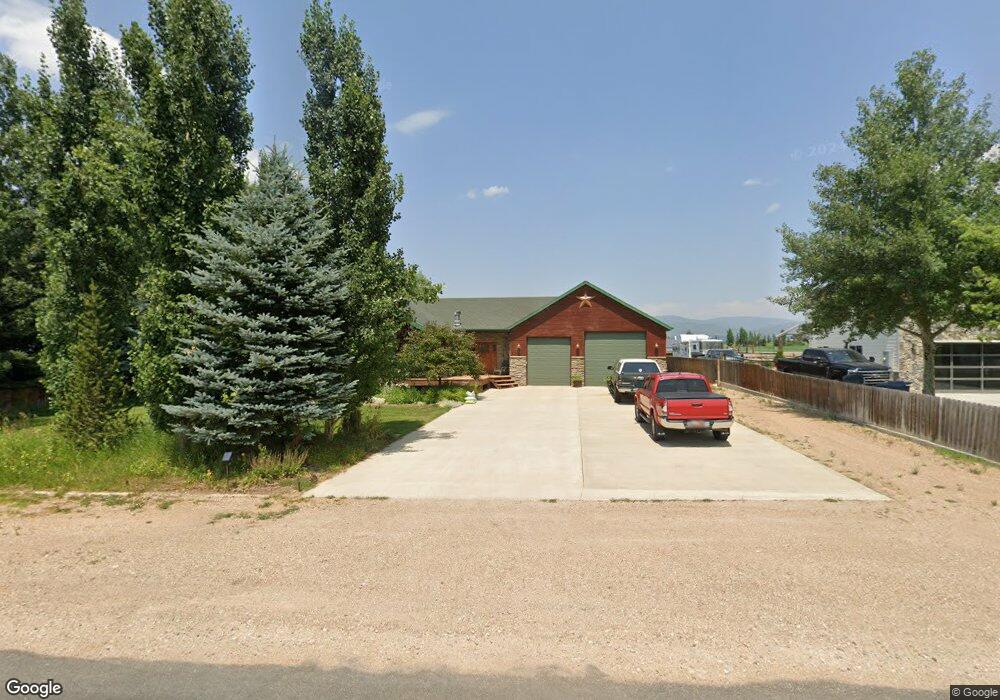
This home is located at 340 W Lower Loop Rd, Kamas, UT 84036 and is currently estimated at $1,093,600, approximately $366 per square foot. 340 W Lower Loop Rd is a home located in Summit County with nearby schools including South Summit Elementary School and South Summit High School.
Ownership History
Date
Name
Owned For
Owner Type
Purchase Details
Closed on
Sep 29, 2015
Sold by
Owen Patricia A
Bought by
Owen Patricia Ann and The Patricia Ann Owen Trust
Current Estimated Value
Purchase Details
Closed on
Mar 21, 2013
Sold by
Farrington Rachel N
Bought by
Owen Patricia A
Home Financials for this Owner
Home Financials are based on the most recent Mortgage that was taken out on this home.
Original Mortgage
$150,000
Outstanding Balance
$104,754
Interest Rate
3.54%
Mortgage Type
New Conventional
Estimated Equity
$988,846
Purchase Details
Closed on
Dec 11, 2008
Sold by
Farrington Rachel and Farrington Rachel N
Bought by
Farrington Rachel N
Home Financials for this Owner
Home Financials are based on the most recent Mortgage that was taken out on this home.
Original Mortgage
$238,000
Interest Rate
6.47%
Mortgage Type
New Conventional
Purchase Details
Closed on
Dec 5, 2008
Sold by
Farrington Rachel and Farrington Rachel N
Bought by
Farrington Rachel N
Home Financials for this Owner
Home Financials are based on the most recent Mortgage that was taken out on this home.
Original Mortgage
$238,000
Interest Rate
6.47%
Mortgage Type
New Conventional
Create a Home Valuation Report for This Property
The Home Valuation Report is an in-depth analysis detailing your home's value as well as a comparison with similar homes in the area
Home Values in the Area
Average Home Value in this Area
Purchase History
| Date | Buyer | Sale Price | Title Company |
|---|---|---|---|
| Owen Patricia Ann | -- | None Available | |
| Owen Patricia A | -- | None Available | |
| Farrington Rachel N | -- | Title West | |
| Farrington Rachel N | -- | Title West |
Source: Public Records
Mortgage History
| Date | Status | Borrower | Loan Amount |
|---|---|---|---|
| Open | Owen Patricia A | $150,000 | |
| Previous Owner | Farrington Rachel N | $238,000 | |
| Previous Owner | Farrington Rachel N | $238,000 |
Source: Public Records
Tax History
| Year | Tax Paid | Tax Assessment Tax Assessment Total Assessment is a certain percentage of the fair market value that is determined by local assessors to be the total taxable value of land and additions on the property. | Land | Improvement |
|---|---|---|---|---|
| 2025 | $2,875 | $476,976 | $135,000 | $341,976 |
| 2024 | $2,396 | $459,047 | $126,750 | $332,297 |
| 2023 | $2,396 | $459,047 | $126,750 | $332,297 |
| 2022 | $2,167 | $320,274 | $52,500 | $267,774 |
| 2021 | $2,061 | $246,071 | $52,500 | $193,571 |
| 2020 | $1,830 | $200,905 | $52,500 | $148,405 |
| 2019 | $1,756 | $200,905 | $52,500 | $148,405 |
| 2018 | $1,782 | $184,774 | $52,500 | $132,274 |
| 2017 | $1,566 | $168,259 | $43,700 | $124,559 |
| 2016 | $1,520 | $155,475 | $37,650 | $117,825 |
| 2015 | $1,344 | $155,475 | $0 | $0 |
| 2013 | $1,452 | $155,475 | $0 | $0 |
Source: Public Records
Map
Nearby Homes
- 307 W Lazy Acres Ln
- 45 W 3155 N
- 240 W Simpson Ln Unit 512
- 960 Splendor Valley Rd Unit 70
- 87 Splendor Valley Rd Unit 87
- 9 Splendor Valley Rd
- 97 Splendor Valley Rd Unit 97
- 1046 Cabin Way Unit 23
- 1164 Cabin Way Unit 9
- 250 W Simpson Ln
- 908 Cabin Way
- 750 E 3200 N
- 1212 Splendor Valley Rd
- 1962 Angels Landing Unit 57-1
- 3042 N Democrat Aly
- 1228 Wasatch View Dr Unit 18
- 1121 Wasatch View Dr Unit 4
- 1165 Wasatch View Dr Unit 3
- 455 Thorn Creek Dr
- 1156 Wasatch View Dr Unit 17
Your Personal Tour Guide
Ask me questions while you tour the home.