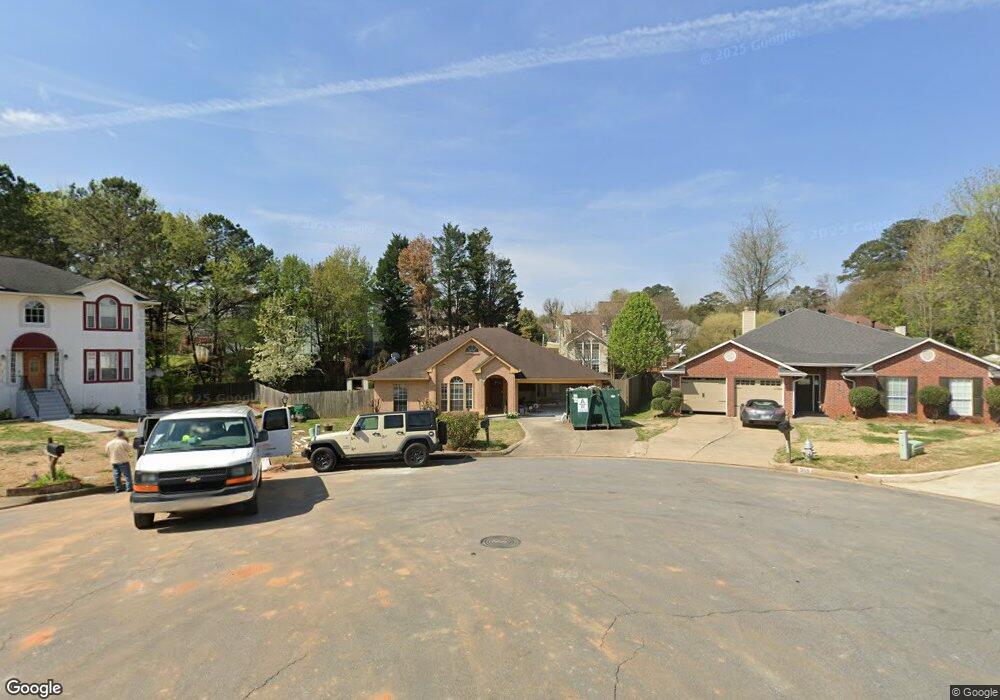
340 W Taylors Crossing Unit IIA Alpharetta, GA 30022
Estimated Value: $506,000 - $526,000
4
Beds
2
Baths
1,867
Sq Ft
$278/Sq Ft
Est. Value
About This Home
This home is located at 340 W Taylors Crossing Unit IIA, Alpharetta, GA 30022 and is currently estimated at $519,037, approximately $278 per square foot. 340 W Taylors Crossing Unit IIA is a home located in Fulton County with nearby schools including State Bridge Crossing Elementary School, Taylor Road Middle School, and Chattahoochee High School.
Ownership History
Date
Name
Owned For
Owner Type
Purchase Details
Closed on
Nov 5, 2012
Sold by
Lin Jin
Bought by
Lin Jin and Wu Xiang
Current Estimated Value
Home Financials for this Owner
Home Financials are based on the most recent Mortgage that was taken out on this home.
Original Mortgage
$99,200
Outstanding Balance
$68,582
Interest Rate
3.4%
Mortgage Type
New Conventional
Estimated Equity
$450,455
Purchase Details
Closed on
Jul 23, 1999
Sold by
Wu Jen and Wu Ho
Bought by
Lin Jin
Home Financials for this Owner
Home Financials are based on the most recent Mortgage that was taken out on this home.
Original Mortgage
$106,400
Interest Rate
7.7%
Mortgage Type
New Conventional
Purchase Details
Closed on
Dec 20, 1993
Sold by
Mitchell D Kelli
Bought by
Wu Jenho Chiang Hsiu
Home Financials for this Owner
Home Financials are based on the most recent Mortgage that was taken out on this home.
Original Mortgage
$97,650
Interest Rate
7.1%
Create a Home Valuation Report for This Property
The Home Valuation Report is an in-depth analysis detailing your home's value as well as a comparison with similar homes in the area
Home Values in the Area
Average Home Value in this Area
Purchase History
| Date | Buyer | Sale Price | Title Company |
|---|---|---|---|
| Lin Jin | -- | -- | |
| Lin Jin | $132,000 | -- | |
| Wu Jenho Chiang Hsiu | $102,800 | -- |
Source: Public Records
Mortgage History
| Date | Status | Borrower | Loan Amount |
|---|---|---|---|
| Open | Lin Jin | $99,200 | |
| Previous Owner | Lin Jin | $106,400 | |
| Previous Owner | Wu Jenho Chiang Hsiu | $97,650 |
Source: Public Records
Tax History Compared to Growth
Tax History
| Year | Tax Paid | Tax Assessment Tax Assessment Total Assessment is a certain percentage of the fair market value that is determined by local assessors to be the total taxable value of land and additions on the property. | Land | Improvement |
|---|---|---|---|---|
| 2025 | $5,516 | $172,000 | $56,840 | $115,160 |
| 2023 | $4,876 | $172,760 | $44,360 | $128,400 |
| 2022 | $4,248 | $138,440 | $46,840 | $91,600 |
| 2021 | $3,817 | $121,160 | $38,720 | $82,440 |
| 2020 | $3,276 | $119,720 | $38,240 | $81,480 |
| 2019 | $292 | $117,640 | $37,600 | $80,040 |
| 2018 | $2,651 | $97,240 | $26,280 | $70,960 |
| 2017 | $2,342 | $80,960 | $18,080 | $62,880 |
| 2016 | $2,226 | $80,960 | $18,080 | $62,880 |
| 2015 | $2,021 | $72,000 | $18,080 | $53,920 |
| 2014 | $1,689 | $60,920 | $15,280 | $45,640 |
Source: Public Records
Map
Nearby Homes
- 5022 Anclote Dr
- 200 Boca Ciega Ct
- 4965 Cinnabar Dr
- 10840 Mortons Crossing
- 5060 Cinnabar Dr
- 4815 Tanners Spring Dr
- 225 Morton Creek Cir
- 220 Magnolia Tree Ct
- 465 Mikasa Dr
- 4826 Abberley Ln
- 4965 N Bridges Dr
- 10906 Gallier St
- 5425 Taylor Rd Unit 2
- 230 Pinebridge Ct
- 10570 Bridgemor Dr
- 11150 Highfield Chase Dr
- 11125 Linbrook Ln
- 130 Douglas Fir Ct Unit 1
- 4740 Carversham Way
- 355 W Taylors Crossing
- 385 Tanners Crossing
- 395 Tanners Crossing
- 330 W Taylors Crossing
- 375 Tanners Crossing
- 320 W Taylors Crossing
- 345 W Taylors Crossing
- 405 Tanners Crossing
- 335 W Taylors Crossing
- 310 W Taylors Crossing
- 365 Tanners Crossing
- 325 W Taylors Crossing
- 11120 Mortons Crossing
- 415 Tanners Crossing
- 330 Tanners Crossing Unit 3
- 11130 Mortons Crossing
- W W Taylors Crossing
- W W Taylors Crossing Unit 25
- 5101 Anclote Dr
- 11140 Mortons Crossing Unit 2A