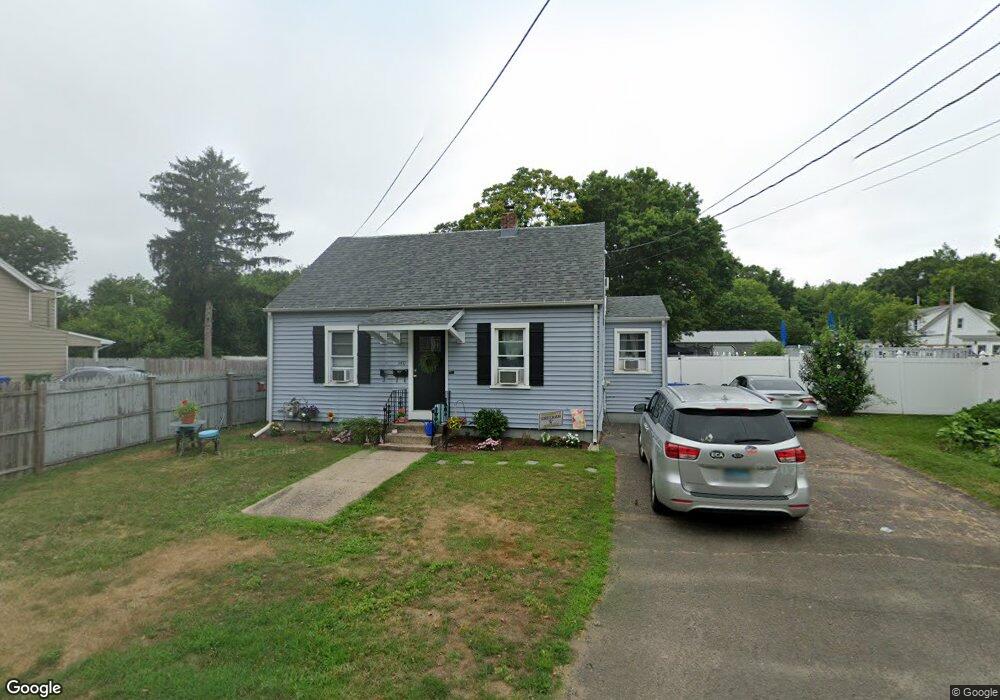
340 Washington St Wallingford, CT 06492
Estimated Value: $337,835 - $401,000
3
Beds
2
Baths
1,243
Sq Ft
$286/Sq Ft
Est. Value
About This Home
This home is located at 340 Washington St, Wallingford, CT 06492 and is currently estimated at $355,459, approximately $285 per square foot. 340 Washington St is a home located in New Haven County with nearby schools including Evarts C. Stevens School, Parker Farms School, and James H. Moran Middle School.
Ownership History
Date
Name
Owned For
Owner Type
Purchase Details
Closed on
May 6, 2009
Sold by
Werman Lauren and Fleming James
Bought by
Cozzi Joshua W and Cozzi Kelly B
Current Estimated Value
Home Financials for this Owner
Home Financials are based on the most recent Mortgage that was taken out on this home.
Original Mortgage
$191,468
Outstanding Balance
$120,255
Interest Rate
4.9%
Estimated Equity
$235,204
Purchase Details
Closed on
Jul 1, 2004
Sold by
Rizzo Michael E and Husted Edward H
Bought by
Werman Lauren and Fleming James
Purchase Details
Closed on
Jun 8, 1999
Sold by
Marciano Frank and Marciano Mary
Bought by
Husted Edward M and Alldredge Tracy M
Purchase Details
Closed on
May 31, 1995
Sold by
Riccio Andrew R and Riccio Joanne
Bought by
Marciano Frank and Marciano Mary
Purchase Details
Closed on
May 12, 1989
Sold by
Latham Elizabeth A
Bought by
Riccio Andrew R
Create a Home Valuation Report for This Property
The Home Valuation Report is an in-depth analysis detailing your home's value as well as a comparison with similar homes in the area
Home Values in the Area
Average Home Value in this Area
Purchase History
| Date | Buyer | Sale Price | Title Company |
|---|---|---|---|
| Cozzi Joshua W | $195,000 | -- | |
| Cozzi Joshua W | $195,000 | -- | |
| Werman Lauren | $165,000 | -- | |
| Werman Lauren | $165,000 | -- | |
| Husted Edward M | $113,500 | -- | |
| Husted Edward M | $113,500 | -- | |
| Marciano Frank | $105,000 | -- | |
| Marciano Frank | $105,000 | -- | |
| Riccio Andrew R | $128,000 | -- |
Source: Public Records
Mortgage History
| Date | Status | Borrower | Loan Amount |
|---|---|---|---|
| Open | Riccio Andrew R | $191,468 | |
| Closed | Riccio Andrew R | $191,468 |
Source: Public Records
Tax History
| Year | Tax Paid | Tax Assessment Tax Assessment Total Assessment is a certain percentage of the fair market value that is determined by local assessors to be the total taxable value of land and additions on the property. | Land | Improvement |
|---|---|---|---|---|
| 2025 | $4,479 | $185,700 | $71,800 | $113,900 |
| 2024 | $3,882 | $126,600 | $59,900 | $66,700 |
| 2023 | $3,714 | $126,600 | $59,900 | $66,700 |
| 2022 | $3,676 | $126,600 | $59,900 | $66,700 |
| 2021 | $3,611 | $126,600 | $59,900 | $66,700 |
| 2020 | $3,488 | $119,500 | $58,700 | $60,800 |
| 2019 | $3,488 | $119,500 | $58,700 | $60,800 |
| 2018 | $3,422 | $119,500 | $58,700 | $60,800 |
| 2017 | $3,412 | $119,500 | $58,700 | $60,800 |
| 2016 | $3,333 | $119,500 | $58,700 | $60,800 |
| 2015 | $3,321 | $120,900 | $58,700 | $62,200 |
| 2014 | $3,251 | $120,900 | $58,700 | $62,200 |
Source: Public Records
Map
Nearby Homes
- 85 N Colony St
- 90 Masonic Ave
- 71 Cedar Ln
- 42 S Cherry St Unit 238
- 570 N Main St
- 30 Clinton Place
- 70 N Turnpike Rd Unit 21
- 120 S Cherry St
- 31 S Turnpike Rd Unit C2
- 30 King St
- 54 Parker Farms Rd
- 61 Cheshire Rd
- 230 Main St Unit 18
- 5 Kish Place
- 3 Loving Ln
- 46 Walnut Ln
- 204 Parker Farms Rd
- 1 Dean Dr
- 54 High St
- 22 Harnish Ln
- 344 Washington St
- 330 Washington St
- 11 Lake St
- 326 Washington St
- 348 Washington St
- 21 Lake St
- 356 Washington St
- 35 Lake St
- 360 Washington St
- 321 Washington St
- 43 Lake St
- 319 Washington St
- 53 Parker St Unit Building D
- 53 Parker St
- 53 Parker St
- 53 Parker St Unit B1, Building F
- 53 Parker St Unit A6, Building E
- 53 Parker St Unit A5 - Building E
- 53 Parker St Unit A4 - Building E
- 53 Parker St Unit A1, A2, A3 - Buildin
Your Personal Tour Guide
Ask me questions while you tour the home.