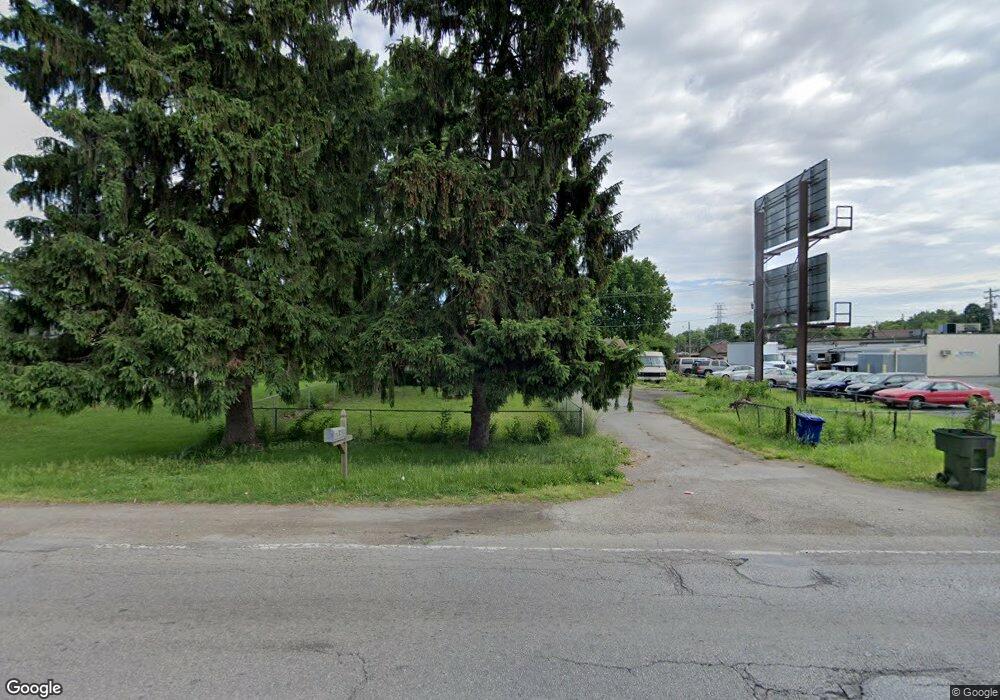
340 Williams Rd Columbus, OH 43207
Obetz-Lockbourne NeighborhoodEstimated Value: $161,000 - $182,918
3
Beds
1
Bath
980
Sq Ft
$177/Sq Ft
Est. Value
About This Home
This home is located at 340 Williams Rd, Columbus, OH 43207 and is currently estimated at $173,230, approximately $176 per square foot. 340 Williams Rd is a home located in Franklin County with nearby schools including Parsons Elementary School, Buckeye Middle School, and Marion-Franklin High School.
Ownership History
Date
Name
Owned For
Owner Type
Purchase Details
Closed on
Apr 19, 2021
Sold by
Graves Richard C
Bought by
Weaver Bradley
Current Estimated Value
Purchase Details
Closed on
Aug 27, 2008
Sold by
Graves Amanda R and Case #08 Dr 001247
Bought by
Graves Richard C
Home Financials for this Owner
Home Financials are based on the most recent Mortgage that was taken out on this home.
Original Mortgage
$71,250
Interest Rate
6.54%
Mortgage Type
Purchase Money Mortgage
Purchase Details
Closed on
Apr 14, 2004
Sold by
Blake Glenna J and Estate Of Hester Hall
Bought by
Graves Richard C and Graves Amanda R
Home Financials for this Owner
Home Financials are based on the most recent Mortgage that was taken out on this home.
Original Mortgage
$65,110
Interest Rate
5.66%
Mortgage Type
Purchase Money Mortgage
Purchase Details
Closed on
Aug 14, 1992
Bought by
Hall Hester
Purchase Details
Closed on
Feb 2, 1990
Purchase Details
Closed on
Mar 23, 1989
Create a Home Valuation Report for This Property
The Home Valuation Report is an in-depth analysis detailing your home's value as well as a comparison with similar homes in the area
Home Values in the Area
Average Home Value in this Area
Purchase History
| Date | Buyer | Sale Price | Title Company |
|---|---|---|---|
| Weaver Bradley | $57,000 | Axis Title Agency Ltd | |
| Graves Richard C | -- | Chase Title | |
| Graves Richard C | $76,600 | Titlequest Agency Inc | |
| Hall Hester | $56,000 | -- | |
| -- | $46,400 | -- | |
| -- | -- | -- |
Source: Public Records
Mortgage History
| Date | Status | Borrower | Loan Amount |
|---|---|---|---|
| Previous Owner | Graves Richard C | $71,250 | |
| Previous Owner | Graves Richard C | $65,110 |
Source: Public Records
Tax History Compared to Growth
Tax History
| Year | Tax Paid | Tax Assessment Tax Assessment Total Assessment is a certain percentage of the fair market value that is determined by local assessors to be the total taxable value of land and additions on the property. | Land | Improvement |
|---|---|---|---|---|
| 2024 | $2,209 | $48,200 | $17,290 | $30,910 |
| 2023 | $2,181 | $48,195 | $17,290 | $30,905 |
| 2022 | $1,479 | $27,830 | $14,740 | $13,090 |
| 2021 | $1,655 | $27,830 | $14,740 | $13,090 |
| 2020 | $2,168 | $27,830 | $14,740 | $13,090 |
| 2019 | $1,784 | $24,120 | $12,810 | $11,310 |
| 2018 | $1,631 | $24,120 | $12,810 | $11,310 |
| 2017 | $1,753 | $24,120 | $12,810 | $11,310 |
| 2016 | $1,676 | $21,110 | $6,440 | $14,670 |
| 2015 | $1,522 | $21,110 | $6,440 | $14,670 |
| 2014 | $1,309 | $21,110 | $6,440 | $14,670 |
| 2013 | $710 | $22,225 | $6,790 | $15,435 |
Source: Public Records
Map
Nearby Homes
- 3414 Parsons Ave
- 3380 Parsons Ave
- 256 Rumsey Rd Unit 258
- 245 Marilla Rd
- 125 Williams Rd
- 445 Basswood Rd
- 503 Ashwood Rd
- 525 Ashwood Rd
- 3714 Parsons Ave
- 3691 Ferman Rd
- 3161 Lewis Rd
- 1633-1635 E Greenway Ave
- 3747 Ferman Rd
- 3735 Christie Rd W
- 0 Parsons Ave Unit 225012522
- 662 Bartfield Dr
- 228 Currier Dr
- 696 Williams Rd
- 0 Williams Rd
- 3785 S Ohio Ave