Estimated Value: $498,000 - $550,000
3
Beds
3
Baths
2,931
Sq Ft
$176/Sq Ft
Est. Value
About This Home
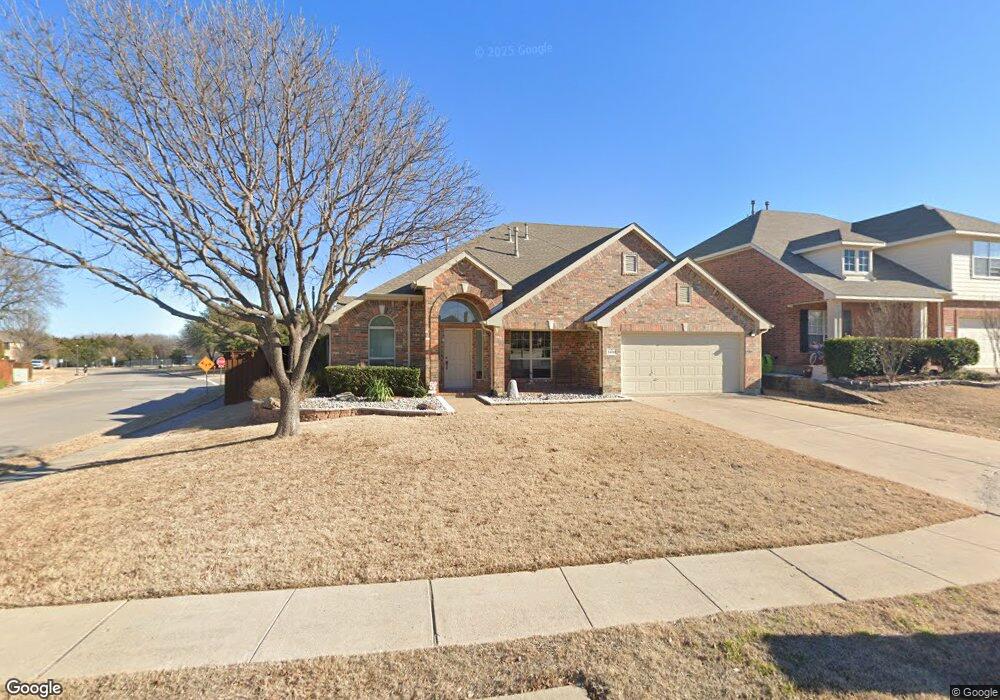
This home is located at 3400 Brookside Dr, Wylie, TX 75098 and is currently estimated at $516,842, approximately $176 per square foot. 3400 Brookside Dr is a home located in Collin County with nearby schools including R V Groves Elementary School, Dr. Al Draper Intermediate Middle School, and Raymond B Cooper J High School.
Ownership History
Date
Name
Owned For
Owner Type
Purchase Details
Closed on
Jul 31, 2012
Sold by
Howard Christina R and Howard John W
Bought by
Hudgens Carol D
Current Estimated Value
Home Financials for this Owner
Home Financials are based on the most recent Mortgage that was taken out on this home.
Original Mortgage
$163,200
Interest Rate
3.68%
Mortgage Type
Purchase Money Mortgage
Purchase Details
Closed on
Sep 3, 2001
Sold by
Mhi Partnership Ltd
Bought by
Howard Christina R
Home Financials for this Owner
Home Financials are based on the most recent Mortgage that was taken out on this home.
Original Mortgage
$160,000
Interest Rate
6.98%
Mortgage Type
Construction
Purchase Details
Closed on
Jan 24, 2001
Sold by
Ashton Custer Llc
Bought by
Mhi Partnership Ltd
Create a Home Valuation Report for This Property
The Home Valuation Report is an in-depth analysis detailing your home's value as well as a comparison with similar homes in the area
Home Values in the Area
Average Home Value in this Area
Purchase History
| Date | Buyer | Sale Price | Title Company |
|---|---|---|---|
| Hudgens Carol D | -- | Fatco | |
| Howard Christina R | -- | -- | |
| Mhi Partnership Ltd | -- | -- |
Source: Public Records
Mortgage History
| Date | Status | Borrower | Loan Amount |
|---|---|---|---|
| Closed | Hudgens Carol D | $163,200 | |
| Previous Owner | Howard Christina R | $160,000 | |
| Closed | Howard Christina R | $20,004 |
Source: Public Records
Tax History Compared to Growth
Tax History
| Year | Tax Paid | Tax Assessment Tax Assessment Total Assessment is a certain percentage of the fair market value that is determined by local assessors to be the total taxable value of land and additions on the property. | Land | Improvement |
|---|---|---|---|---|
| 2025 | $2,072 | $509,439 | $150,000 | $393,424 |
| 2024 | $2,072 | $463,126 | $150,000 | $349,267 |
| 2023 | $2,072 | $421,024 | $132,000 | $383,269 |
| 2022 | $8,397 | $382,749 | $108,000 | $332,255 |
| 2021 | $8,187 | $348,803 | $84,000 | $264,803 |
| 2020 | $7,854 | $316,322 | $78,000 | $238,322 |
| 2019 | $8,369 | $318,476 | $78,000 | $240,476 |
| 2018 | $8,314 | $308,702 | $78,000 | $230,702 |
| 2017 | $7,801 | $297,549 | $72,000 | $225,549 |
| 2016 | $7,317 | $267,306 | $60,000 | $207,306 |
| 2015 | $3,086 | $241,564 | $54,000 | $187,564 |
Source: Public Records
Map
Nearby Homes
- 3119 Connor Ln
- 802 Appalachian Dr
- 3014 Eastwood Dr
- 517 Royal Oak Dr
- 563 John Ross Rd
- 3105 Admiral Dr
- 2912 Katie Cir
- 310 Admiral Dr
- 1205 Periwinkle Dr
- 307 Wooded Creek Ave
- 413 Royal Oak Dr
- 2907 Abby Ln
- 620 Fall Wheat Dr
- 801 Hunters Glen
- 3111 Candlebrook Dr
- 728 Morningside Trail
- 3003 Candlebrook Dr
- 3017 Eagle Mountain Dr
- 3103 Creekwood Dr
- 3600 Nandina Dr
- 3402 Brookside Dr
- 3400 Cascade Ct
- 608 Althea Dr
- 3404 Brookside Dr
- 901 Fountain Dr
- 3402 Cascade Ct
- 3401 Brookside Dr
- 606 Althea Dr
- 607 Althea Dr
- 903 Fountain Dr
- 3401 Cascade Ct
- 3118 Claybrook Dr
- 3405 Cascade Ct
- 3406 Brookside Dr
- 3403 Cascade Ct
- 905 Fountain Dr
- 605 Althea Dr
- 604 Althea Dr
- 802 Bayou Ct
- 3116 Claybrook Dr