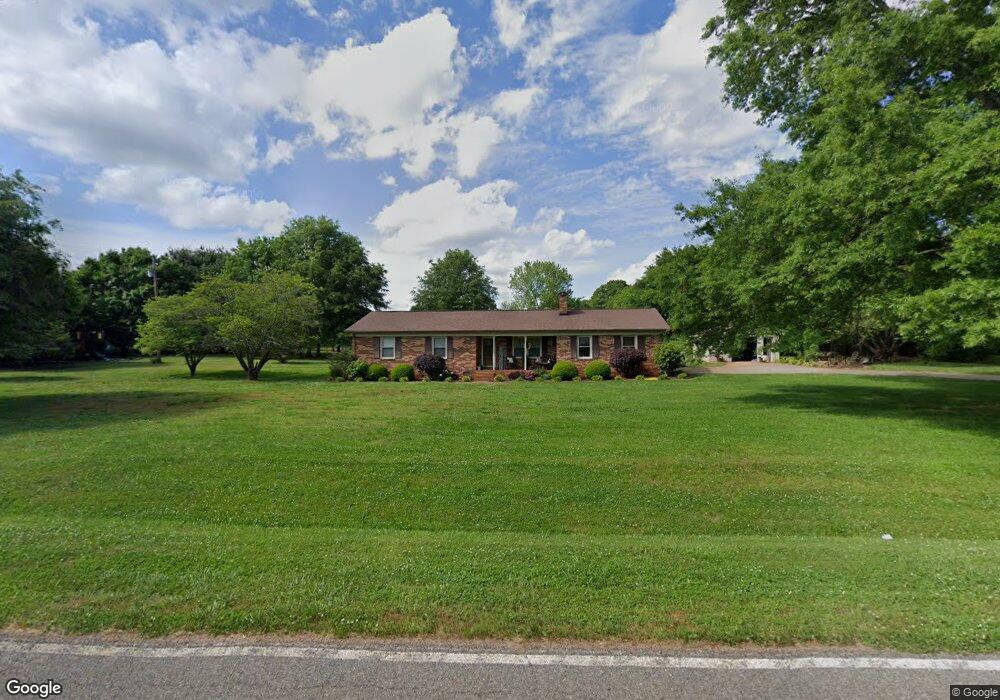
3400 Dave Heafner Rd Crouse, NC 28033
Estimated Value: $260,000 - $356,000
3
Beds
2
Baths
1,319
Sq Ft
$226/Sq Ft
Est. Value
About This Home
This home is located at 3400 Dave Heafner Rd, Crouse, NC 28033 and is currently estimated at $298,590, approximately $226 per square foot. 3400 Dave Heafner Rd is a home located in Lincoln County with nearby schools including Love Memorial Elementary School, West Lincoln Middle, and West Lincoln High School.
Ownership History
Date
Name
Owned For
Owner Type
Purchase Details
Closed on
Jan 27, 2021
Sold by
Chambers Properties Inc
Bought by
Dionysus Investments Llc
Current Estimated Value
Home Financials for this Owner
Home Financials are based on the most recent Mortgage that was taken out on this home.
Original Mortgage
$446,782
Outstanding Balance
$399,390
Interest Rate
2.67%
Mortgage Type
Commercial
Estimated Equity
-$100,800
Purchase Details
Closed on
Aug 1, 2018
Sold by
3D Worldwide Llc
Bought by
Chambers Properties Inc
Home Financials for this Owner
Home Financials are based on the most recent Mortgage that was taken out on this home.
Original Mortgage
$468,000
Interest Rate
4.5%
Mortgage Type
Commercial
Purchase Details
Closed on
Jan 18, 2013
Sold by
5M Llc
Bought by
Race City Steal Inc
Create a Home Valuation Report for This Property
The Home Valuation Report is an in-depth analysis detailing your home's value as well as a comparison with similar homes in the area
Home Values in the Area
Average Home Value in this Area
Purchase History
| Date | Buyer | Sale Price | Title Company |
|---|---|---|---|
| Dionysus Investments Llc | -- | None Available | |
| Chambers Properties Inc | $585,000 | None Available | |
| Race City Steal Inc | $367,500 | None Available |
Source: Public Records
Mortgage History
| Date | Status | Borrower | Loan Amount |
|---|---|---|---|
| Open | Dionysus Investments Llc | $446,782 | |
| Previous Owner | Chambers Properties Inc | $468,000 |
Source: Public Records
Tax History Compared to Growth
Tax History
| Year | Tax Paid | Tax Assessment Tax Assessment Total Assessment is a certain percentage of the fair market value that is determined by local assessors to be the total taxable value of land and additions on the property. | Land | Improvement |
|---|---|---|---|---|
| 2025 | $1,655 | $246,669 | $40,772 | $205,897 |
| 2024 | $1,635 | $246,669 | $40,772 | $205,897 |
| 2023 | $1,558 | $246,669 | $40,772 | $205,897 |
| 2022 | $1,234 | $158,727 | $28,254 | $130,473 |
| 2021 | $1,234 | $158,727 | $28,254 | $130,473 |
| 2020 | $1,087 | $158,727 | $28,254 | $130,473 |
| 2019 | $1,087 | $158,727 | $28,254 | $130,473 |
| 2018 | $619 | $140,848 | $26,624 | $114,224 |
| 2017 | $951 | $140,848 | $26,624 | $114,224 |
| 2016 | $951 | $140,848 | $26,624 | $114,224 |
| 2015 | $598 | $140,848 | $26,624 | $114,224 |
| 2014 | $595 | $138,104 | $28,015 | $110,089 |
Source: Public Records
Map
Nearby Homes
- 000 Leonards Fork Church Rd
- 1357 Malden Ct
- 1568 Pleasant Grove Church Rd
- 2336 Swanson Rd
- 3103 Richview Dr
- 2297 Swanson Rd
- 1074 Lyndsey Brook Ct
- 1084 Lyndsey Brook Ct
- 2700 Moose Gantt Trail
- 8 Swanson Rd
- 938 Lyndsey Brook Ct
- 1000 Creekside Dr
- 2383 N Carolina 182
- 1214 Pleasant Grove Church Rd
- 3372 Crouse School Rd
- 792 Mace Ln
- 000 Modern Estates Rd
- 1778 Highway 182
- 2130 Drive Inn Rd
- 3224 Harmon Rd
- 3378 Dave Heafner Rd
- 3428 Dave Heafner Rd
- 3367 Dave Heafner Rd
- 3444 Dave Heafner Rd
- 3347 Dave Heafner Rd
- 1931 Kollege Ln
- 3350 Dave Heafner Rd
- 1657 George Brown Rd
- 3348 Dave Heafner Rd
- 1945 Kollege Ln
- 4.008 acres George Brown Rd
- 3507 James Webb Trail
- 00 George Brown Rd
- 1953 Kollege Ln
- Lot 43 Oakdale Dr
- 0000 Oakdale Dr
- 1934 Kollege Ln
- 1689 George Brown Rd
- 3318 Dave Heafner Rd
- 1608 George Brown Rd