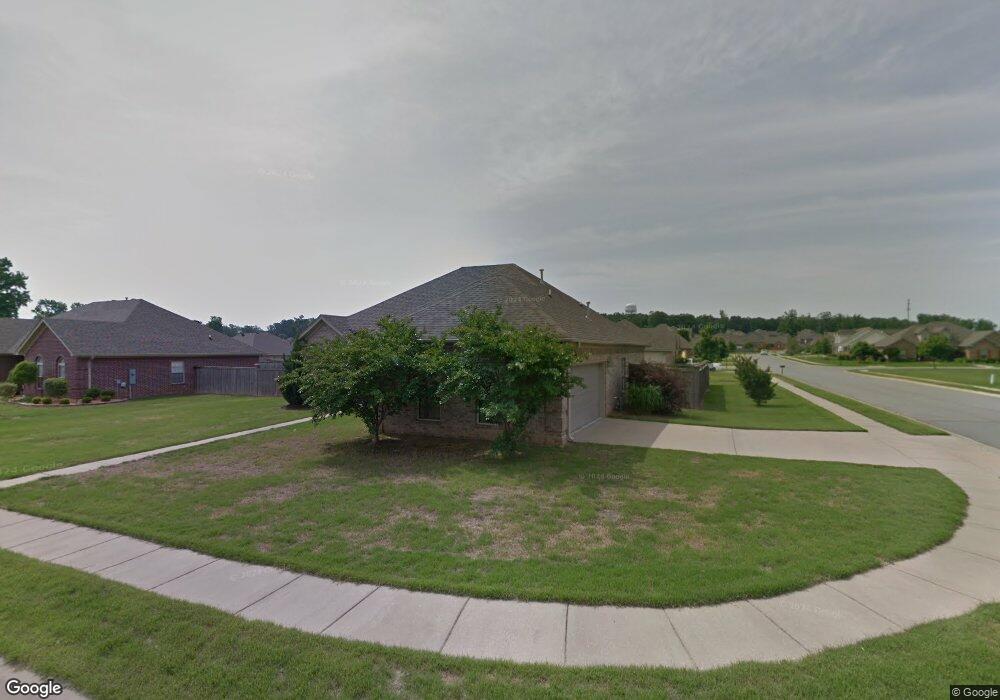
3400 Hemlock Cove Benton, AR 72015
Estimated Value: $316,382 - $326,000
Studio
2
Baths
2,106
Sq Ft
$153/Sq Ft
Est. Value
About This Home
This home is located at 3400 Hemlock Cove, Benton, AR 72015 and is currently estimated at $321,596, approximately $152 per square foot. 3400 Hemlock Cove is a home located in Saline County with nearby schools including Hurricane Creek Elementary School, Arkansas Christian Academy, and Our Lady Of Fatima Catholic School.
Ownership History
Date
Name
Owned For
Owner Type
Purchase Details
Closed on
Oct 22, 2012
Sold by
Rolston Gregory Scott
Bought by
Rolston Rhonda Michele
Current Estimated Value
Purchase Details
Closed on
Mar 20, 2008
Sold by
Bryant Mercus J and Bryant Randi L
Bought by
Rolston Greg S and Rolston Rhonda M
Home Financials for this Owner
Home Financials are based on the most recent Mortgage that was taken out on this home.
Original Mortgage
$1,900,000
Interest Rate
6.11%
Mortgage Type
New Conventional
Purchase Details
Closed on
Mar 18, 2005
Sold by
Jones Jayce
Bought by
Bryant Marcus J and Bryant Randi L
Home Financials for this Owner
Home Financials are based on the most recent Mortgage that was taken out on this home.
Original Mortgage
$158,100
Interest Rate
5.71%
Mortgage Type
New Conventional
Purchase Details
Closed on
Aug 23, 2004
Bought by
Jones J
Purchase Details
Closed on
Aug 18, 2004
Bought by
Jones J
Create a Home Valuation Report for This Property
The Home Valuation Report is an in-depth analysis detailing your home's value as well as a comparison with similar homes in the area
Home Values in the Area
Average Home Value in this Area
Purchase History
| Date | Buyer | Sale Price | Title Company |
|---|---|---|---|
| Rolston Rhonda Michele | -- | None Available | |
| Rolston Greg S | $212,000 | None Available | |
| Bryant Marcus J | $186,000 | -- | |
| Jones J | $33,000 | -- | |
| Jones J | $33,000 | -- |
Source: Public Records
Mortgage History
| Date | Status | Borrower | Loan Amount |
|---|---|---|---|
| Previous Owner | Rolston Greg S | $1,900,000 | |
| Previous Owner | Bryant Marcus J | $158,100 |
Source: Public Records
Tax History
| Year | Tax Paid | Tax Assessment Tax Assessment Total Assessment is a certain percentage of the fair market value that is determined by local assessors to be the total taxable value of land and additions on the property. | Land | Improvement |
|---|---|---|---|---|
| 2025 | $2,555 | $51,889 | $9,000 | $42,889 |
| 2024 | $2,428 | $51,889 | $9,000 | $42,889 |
| 2023 | $2,019 | $51,889 | $9,000 | $42,889 |
| 2022 | $1,958 | $51,889 | $9,000 | $42,889 |
| 2021 | $1,856 | $41,080 | $7,000 | $34,080 |
| 2020 | $1,856 | $41,080 | $7,000 | $34,080 |
| 2019 | $1,856 | $41,080 | $7,000 | $34,080 |
| 2018 | $1,877 | $41,080 | $7,000 | $34,080 |
| 2017 | $1,877 | $41,080 | $7,000 | $34,080 |
| 2016 | $2,060 | $40,070 | $7,000 | $33,070 |
| 2015 | $2,060 | $40,070 | $7,000 | $33,070 |
| 2014 | $1,710 | $40,070 | $7,000 | $33,070 |
Source: Public Records
Map
Nearby Homes
- 3106 Briarstone Dr
- 3702 Buckskin Rd
- 3158 Stonewall Dr
- 3018 Dapple Gray Rd
- 1020 Raven Walk Dr
- 1092 Raven Walk Dr
- 1016 Raven Walk Dr
- 1032 Raven Walk Dr
- 1012 Raven Walk Dr
- 1044 Raven Walk Dr
- 1056 Raven Walk Dr
- 1052 Raven Walk Dr
- 1088 Raven Walk Dr
- 1024 Raven Walk Dr
- 1028 Raven Walk Dr
- 1080 Raven Walk Dr
- 1040 Raven Walk Dr
- 1084 Raven Walk Dr
- 1048 Raven Walk Dr
- 2905 Janet
- 3402 Hemlock Cove
- 3517 Heritage Farm Dr
- 3503 Peachtree Ln
- 3270 Heritage Farm Dr
- 3401 Hemlock Cove
- 3403 Hemlock Cove
- 3401 Peachtree Ln
- 3404 Hemlock Cove
- 0 Hemlock Cove Unit 20026215
- 3505 Peachtree Ln
- 3405 Hemlock Cove
- 3502 Hemlock Cove
- 3399 Peachtree Ln
- 3502 Peachtree Ln
- 3281 Heritage Farm Dr
- 3504 Peachtree Ln
- 3507 Peachtree Ln
- 3406 Hemlock Cove
- 3402 Peachtree Ln
- 3503 Hemlock Cove
Your Personal Tour Guide
Ask me questions while you tour the home.