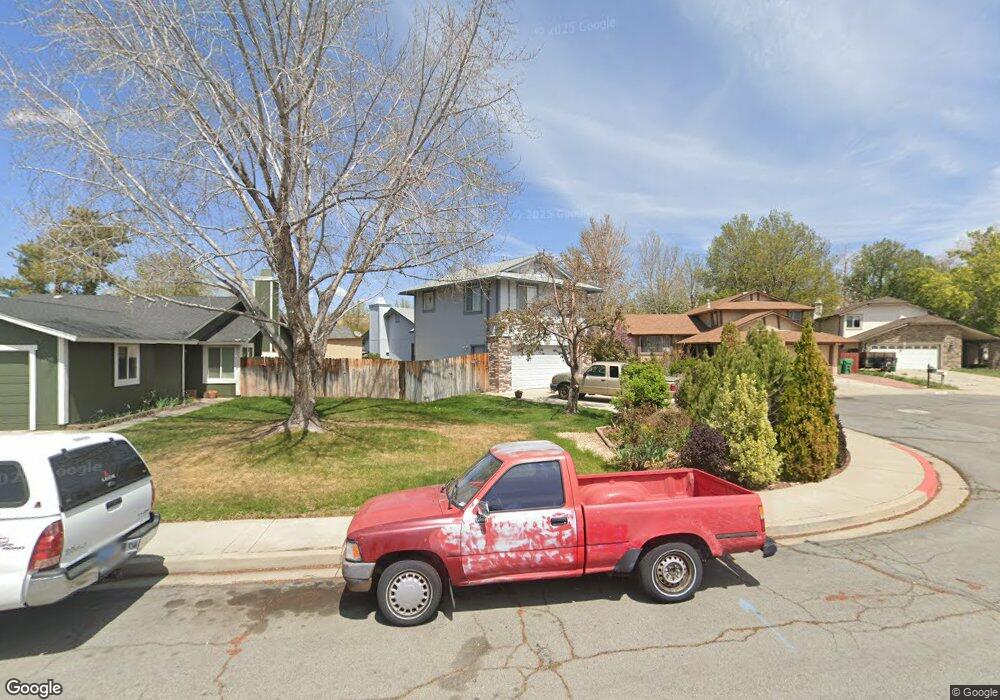
3400 Montezuma Way Sparks, NV 89434
Reed NeighborhoodEstimated Value: $478,000 - $515,000
3
Beds
3
Baths
1,880
Sq Ft
$263/Sq Ft
Est. Value
About This Home
This home is located at 3400 Montezuma Way, Sparks, NV 89434 and is currently estimated at $494,254, approximately $262 per square foot. 3400 Montezuma Way is a home located in Washoe County with nearby schools including Hershal H. Beam Elementary School, Jerry Whitehead Elementary School, and Lou Mendive Middle School.
Ownership History
Date
Name
Owned For
Owner Type
Purchase Details
Closed on
Feb 20, 1998
Sold by
Ocwen Federal Bank Fsb
Bought by
Enzler David and Enzler Cheryl A
Current Estimated Value
Home Financials for this Owner
Home Financials are based on the most recent Mortgage that was taken out on this home.
Original Mortgage
$116,100
Outstanding Balance
$20,370
Interest Rate
6.9%
Estimated Equity
$473,884
Purchase Details
Closed on
Jun 4, 1997
Sold by
Law Offices Of Steven J Melmet Inc
Bought by
Ocwen Federal Bank Fsb and Berkeley Federal Bank & Trust
Create a Home Valuation Report for This Property
The Home Valuation Report is an in-depth analysis detailing your home's value as well as a comparison with similar homes in the area
Home Values in the Area
Average Home Value in this Area
Purchase History
| Date | Buyer | Sale Price | Title Company |
|---|---|---|---|
| Enzler David | $129,000 | First Centennial Title Co | |
| Ocwen Federal Bank Fsb | $110,487 | Western Title Company Inc |
Source: Public Records
Mortgage History
| Date | Status | Borrower | Loan Amount |
|---|---|---|---|
| Open | Enzler David | $116,100 |
Source: Public Records
Tax History Compared to Growth
Tax History
| Year | Tax Paid | Tax Assessment Tax Assessment Total Assessment is a certain percentage of the fair market value that is determined by local assessors to be the total taxable value of land and additions on the property. | Land | Improvement |
|---|---|---|---|---|
| 2025 | $2,166 | $83,538 | $36,120 | $47,418 |
| 2024 | $2,166 | $81,473 | $33,215 | $48,258 |
| 2023 | $2,104 | $81,323 | $35,175 | $46,148 |
| 2022 | $2,043 | $65,538 | $26,740 | $38,798 |
| 2021 | $1,985 | $60,649 | $21,735 | $38,914 |
| 2020 | $1,925 | $60,023 | $20,720 | $39,303 |
| 2019 | $1,869 | $58,987 | $20,720 | $38,267 |
| 2018 | $1,812 | $52,141 | $14,455 | $37,686 |
| 2017 | $1,762 | $51,701 | $13,720 | $37,981 |
| 2016 | $1,718 | $51,298 | $12,250 | $39,048 |
| 2015 | $1,715 | $49,556 | $10,325 | $39,231 |
| 2014 | $1,665 | $46,784 | $9,030 | $37,754 |
| 2013 | -- | $44,240 | $6,860 | $37,380 |
Source: Public Records
Map
Nearby Homes
- 3345 Groom Way
- 1575 Olinghouse St
- 3127 Montezuma Way
- 3253 Clan Alpine Dr
- 1557 Satellite Dr
- 1688 Round Mountain Cir
- 1035 Baywood Dr Unit D
- 1069 Palmwood Dr
- 3602 Oakridge Dr
- Plan 4 at Eagle Peak
- Plan 5 at Eagle Peak
- Plan 2 at Eagle Peak
- Plan 1 at Eagle Peak
- Plan 3 at Eagle Peak
- 1029 Baywood Dr Unit D
- 2688 Laguna Way
- 1472 Giannotti Dr
- 2763 Blossom View Dr
- 1031 Vintage Hills Pkwy
- 2407 Sunny Slope Dr Unit 1
- 3420 Montezuma Way
- 3396 Montezuma Way Unit 1
- 1525 Shadow Ln
- 1515 Shadow Ln
- 3440 Montezuma Way
- 1535 Shadow Ln
- 3376 Montezuma Way
- 3386 Montezuma Way
- 1545 Shadow Ln
- 3427 Montezuma Way
- 3460 Montezuma Way
- 3377 Montezuma Way
- 3366 Montezuma Way Unit 1
- 3347 Montezuma Way
- 3437 Montezuma Way Unit 1
- 3480 Montezuma Way
- 1555 Shadow Ln
- 3346 Montezuma Way
- 1480 Shadow Ln
- 1490 Shadow Ln