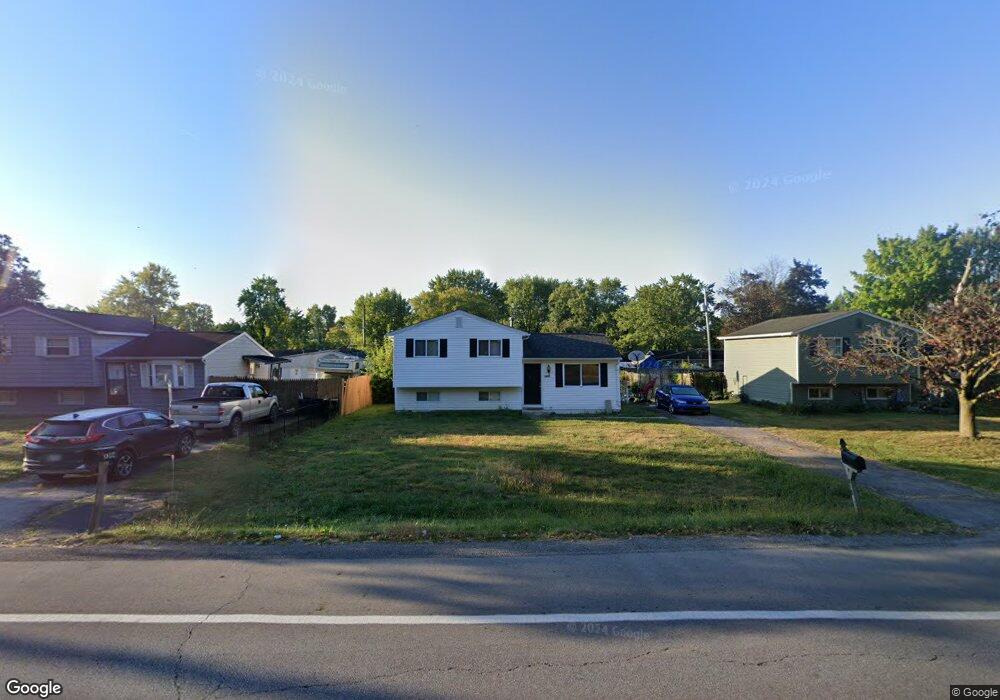
3400 Noe Bixby Rd Columbus, OH 43232
East Columbus-White Ash NeighborhoodEstimated Value: $187,000 - $215,000
3
Beds
1
Bath
1,284
Sq Ft
$154/Sq Ft
Est. Value
About This Home
This home is located at 3400 Noe Bixby Rd, Columbus, OH 43232 and is currently estimated at $197,260, approximately $153 per square foot. 3400 Noe Bixby Rd is a home located in Franklin County with nearby schools including Groveport Madison High School, Eastland Preparatory Academy, and A+ Arts Academy.
Ownership History
Date
Name
Owned For
Owner Type
Purchase Details
Closed on
Aug 3, 2011
Sold by
233 North James Llc
Bought by
330 Invesments Llc
Current Estimated Value
Purchase Details
Closed on
Jul 29, 2011
Sold by
Secretary Of Housing & Urban Development
Bought by
233 North James Llc
Purchase Details
Closed on
Aug 5, 2010
Sold by
Rawson Anthony D and Devore Melissa A
Bought by
Chase Home Finance Llc
Purchase Details
Closed on
Jun 17, 2010
Sold by
Chase Home Finance Llc
Bought by
Secretary Of Housing & Urban Development
Purchase Details
Closed on
Jun 15, 2004
Sold by
Silbaugh Stephen A and Silbaugh Judith N
Bought by
Rawson Anthony D and Devore Melissa A
Home Financials for this Owner
Home Financials are based on the most recent Mortgage that was taken out on this home.
Original Mortgage
$92,449
Interest Rate
6.37%
Mortgage Type
FHA
Purchase Details
Closed on
Jul 21, 1983
Bought by
Silbaugh Stephen A
Create a Home Valuation Report for This Property
The Home Valuation Report is an in-depth analysis detailing your home's value as well as a comparison with similar homes in the area
Home Values in the Area
Average Home Value in this Area
Purchase History
| Date | Buyer | Sale Price | Title Company |
|---|---|---|---|
| 330 Invesments Llc | $22,200 | Stewart Tit | |
| 233 North James Llc | $22,111 | Stewart Tit | |
| Chase Home Finance Llc | $54,000 | Attorney | |
| Secretary Of Housing & Urban Development | -- | None Available | |
| Rawson Anthony D | $93,900 | Chicago Tit | |
| Silbaugh Stephen A | -- | -- |
Source: Public Records
Mortgage History
| Date | Status | Borrower | Loan Amount |
|---|---|---|---|
| Previous Owner | Rawson Anthony D | $92,449 |
Source: Public Records
Tax History Compared to Growth
Tax History
| Year | Tax Paid | Tax Assessment Tax Assessment Total Assessment is a certain percentage of the fair market value that is determined by local assessors to be the total taxable value of land and additions on the property. | Land | Improvement |
|---|---|---|---|---|
| 2024 | $3,348 | $42,000 | $15,190 | $26,810 |
| 2023 | $2,506 | $50,925 | $15,190 | $35,735 |
| 2022 | $986 | $15,760 | $7,180 | $8,580 |
| 2021 | $1,025 | $15,760 | $7,180 | $8,580 |
| 2020 | $1,222 | $18,910 | $7,180 | $11,730 |
| 2019 | $1,161 | $15,760 | $5,990 | $9,770 |
| 2018 | $584 | $15,760 | $5,990 | $9,770 |
| 2017 | $1,881 | $26,570 | $5,990 | $20,580 |
| 2016 | $666 | $7,740 | $4,060 | $3,680 |
| 2015 | $328 | $7,740 | $4,060 | $3,680 |
| 2014 | $574 | $7,740 | $4,060 | $3,680 |
| 2013 | $763 | $23,415 | $4,515 | $18,900 |
Source: Public Records
Map
Nearby Homes
- 3496 Cadell Rd
- 3493 Tremaine Rd
- 3567 Wymore Place
- 5106 Harbor Blvd
- 5044 Albany Dr
- 5004 Bentler Dr
- 3721 Aurelia Dr
- 5152 Burdett Dr
- 5254 Sedalia Dr
- 4940 Brewster Dr
- 4783 Nieles Edge Dr
- 4784 Nieles Edge Dr
- 4655 Glengate Dr
- 4847 Amber Crossing Dr
- 3739 Atkinson Rd
- 3773 Clearwater Dr
- 5391 Newport Rd
- 4496 Reinbeau Dr
- 4468 Reinbeau Dr
- 3773 Tylor Dr
- 3408 Noe Bixby Rd
- 3394 Noe Bixby Rd
- 4930 Wymore Dr
- 4936 Wymore Dr
- 3390 Noe Bixby Rd
- 3416 Noe Bixby Rd
- 4922 Wymore Dr
- 4942 Wymore Dr
- 3386 Noe Bixby Rd
- 4916 Wymore Dr
- 3424 Noe Bixby Rd
- 4958 Wymore Dr
- 4908 Wymore Dr
- 3378 Noe Bixby Rd
- 3432 Noe Bixby Rd
- 4933 Wymore Dr
- 4925 Wymore Dr
- 4943 Wymore Dr
- 4966 Wymore Dr
- 4900 Wymore Dr