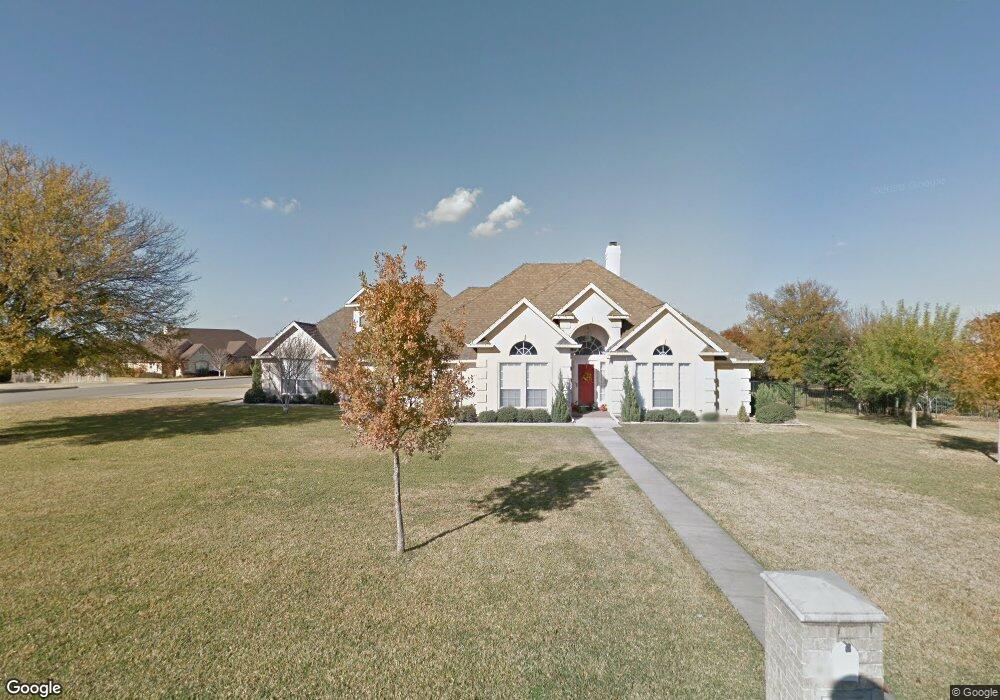
3401 Cliff View Loop Weatherford, TX 76087
Estimated Value: $529,719 - $584,000
4
Beds
3
Baths
2,757
Sq Ft
$206/Sq Ft
Est. Value
About This Home
This home is located at 3401 Cliff View Loop, Weatherford, TX 76087 and is currently estimated at $567,180, approximately $205 per square foot. 3401 Cliff View Loop is a home located in Parker County with nearby schools including Martin Elementary School, Tison Middle School, and Weatherford High School.
Ownership History
Date
Name
Owned For
Owner Type
Purchase Details
Closed on
Jan 29, 2016
Sold by
Babl Curtis G and Babl Vicki S
Bought by
Wooten Thomas M
Current Estimated Value
Home Financials for this Owner
Home Financials are based on the most recent Mortgage that was taken out on this home.
Original Mortgage
$242,800
Outstanding Balance
$193,932
Interest Rate
4.01%
Mortgage Type
Purchase Money Mortgage
Estimated Equity
$373,248
Purchase Details
Closed on
Oct 22, 2014
Sold by
Davis Travis L and Davis Letrice Joyce
Bought by
Babl Curtis G and Babl Vicki S
Purchase Details
Closed on
Aug 30, 2011
Sold by
Shaw Terry M and Shaw Joan A
Bought by
Wooten Thomas M
Purchase Details
Closed on
Feb 17, 1999
Bought by
Wooten Thomas M
Purchase Details
Closed on
Nov 13, 1997
Bought by
Wooten Thomas M
Purchase Details
Closed on
Apr 23, 1996
Bought by
Wooten Thomas M
Purchase Details
Closed on
Jan 1, 1901
Bought by
Wooten Thomas M
Create a Home Valuation Report for This Property
The Home Valuation Report is an in-depth analysis detailing your home's value as well as a comparison with similar homes in the area
Home Values in the Area
Average Home Value in this Area
Purchase History
| Date | Buyer | Sale Price | Title Company |
|---|---|---|---|
| Wooten Thomas M | -- | None Available | |
| Babl Curtis G | -- | Porter Title Company | |
| Wooten Thomas M | -- | -- | |
| Davis Travis L | -- | Providence Title | |
| Wooten Thomas M | -- | -- | |
| Wooten Thomas M | -- | -- | |
| Wooten Thomas M | -- | -- | |
| Wooten Thomas M | -- | -- |
Source: Public Records
Mortgage History
| Date | Status | Borrower | Loan Amount |
|---|---|---|---|
| Open | Wooten Thomas M | $242,800 |
Source: Public Records
Tax History Compared to Growth
Tax History
| Year | Tax Paid | Tax Assessment Tax Assessment Total Assessment is a certain percentage of the fair market value that is determined by local assessors to be the total taxable value of land and additions on the property. | Land | Improvement |
|---|---|---|---|---|
| 2025 | $7,563 | $490,752 | -- | -- |
| 2024 | $7,563 | $446,138 | -- | -- |
| 2023 | $7,563 | $405,580 | $0 | $0 |
| 2022 | $8,178 | $368,710 | $30,000 | $338,710 |
| 2021 | $8,854 | $368,710 | $30,000 | $338,710 |
| 2020 | $8,646 | $357,820 | $30,000 | $327,820 |
| 2019 | $8,547 | $357,820 | $30,000 | $327,820 |
| 2018 | $7,805 | $304,270 | $30,000 | $274,270 |
| 2017 | $8,006 | $304,270 | $30,000 | $274,270 |
| 2016 | $7,015 | $266,610 | $30,000 | $236,610 |
| 2015 | $6,500 | $266,610 | $30,000 | $236,610 |
| 2014 | $6,142 | $244,550 | $30,000 | $214,550 |
Source: Public Records
Map
Nearby Homes
- 3409 Foot Hills Dr
- 3210 Bluebonnet Cir
- 3509 Lakeshore Dr
- 3609 Marina Link
- 221 Valley Ranch Rd
- 3610 Lakeshore Dr
- 3616 Overlook Manor
- 602 Valley Trail Dr
- 318 W Lake Dr
- 106 Winfield St
- 3503 Red Bud Dr
- 408 Canyon Trail Rd
- 302 Red Eagle Trail
- 3806 Lakeshore Dr
- 2911 Inspiration Dr
- 3708 Oak Park Dr Unit A
- 3703 Pecan Park Dr
- TBA N Oakridge Dr
- 109 Norene Ln
- 1317 Thistle Hill Trail
- 3405 Cliff View Loop
- 3404 Foot Hills Dr
- 3307 Cliff View Ct
- 3402 Cliff View Loop
- 3409 Foot Hills Dr
- 3406 Cliff View Loop
- 3409 Cliff View Loop
- 3305 Cliff View Ct
- 3413 Foot Hills Dr
- 3410 Cliff View Loop
- 3406 Quanah Trail
- 3410 Foot Hills Dr
- 3306 Cliff View Ct
- 3413 Cliff View Loop
- 3308 Stage Coach Trail
- 3417 Foot Hills Dr
- 3404 Brush Creek Dr
- 3414 Cliff View Loop
- 3306 Stage Coach Trail
- 3404 Stage Coach Trail