


PENDING
$49K PRICE DROP
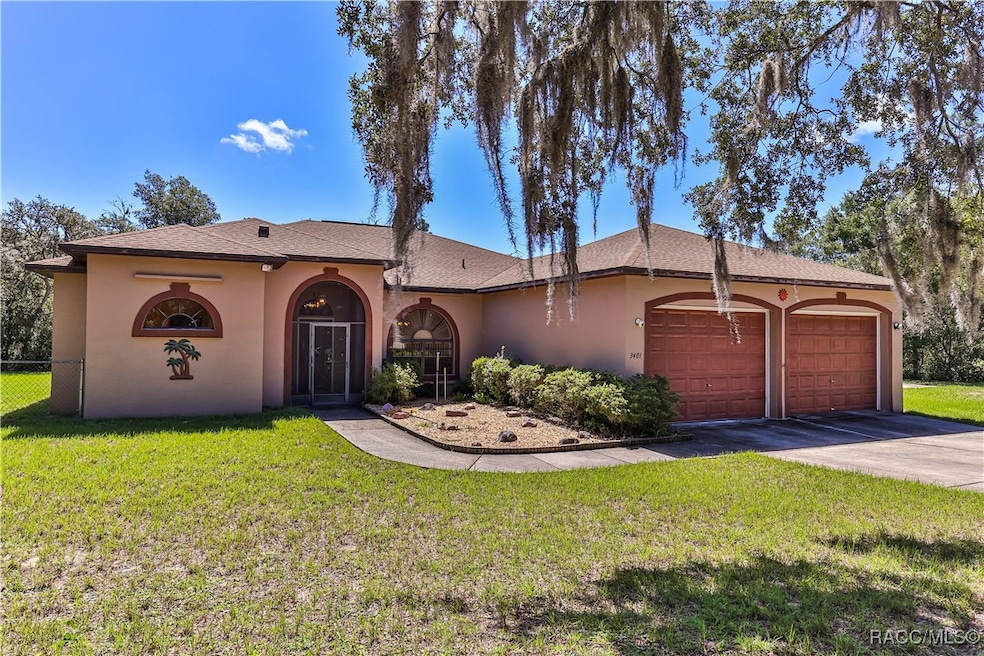
3401 N Bonnie Point Hernando, FL 34442
Estimated payment $3,039/month
Total Views
43,349
3
Beds
2
Baths
2,393
Sq Ft
$230
Price per Sq Ft
Highlights
- 4.89 Acre Lot
- Contemporary Architecture
- No HOA
- Room in yard for a pool
- Wooded Lot
- Breakfast Area or Nook
About This Home
Five Acre lots in this very quiet and rural feeling part of Hernando are extremely rare and smaller 1 acre lots sell for an average of $40k in Forest Lake. This 4.89-acre lot is fully fenced with chain-link and has a nice mow barrier all around it. There is also a 20x35 concrete pad near the home with a 50-amp power supply box. This pad is ready for a barn or detached garage structure or just park your RV & boat there. A new roof was installed on the home in 2023. The garage is 960 SF with a 135' long and 25'+ wide concrete driveway. The master bathroom has been enlarged from the drawings provided. The 3-bedroom 2-bath home features a split plan layout with a 14x28 living room with access out to a 34x8 lanai which if fully built in with CBS walls and windows. Full hurricane metal panels convey with purchase. There is also a back Florida room that measures 16x19. All ceilings are 9-10 feet high with tray features in the master bedroom and Florida Room. NO HOA, NO FLOOD ZONE, NO FLOOD INSURANCE REQUIRED. 10-minute drive into Hernando or Citrus Hills for shopping and restaurants. Granite countertops in kitchen, plenty of closets, tile, carpet & laminate flooring. There's a small breakfast nook adjacent to the kitchen and a 10x10 dining area also. This owner built the home in 2005 and has lived there since then. Schools: Hernando Elementary, Citrus Springs Middle School and Lecanto High Schools - The best Citrus County has to offer! Call for your private showing.
Home Details
Home Type
- Single Family
Est. Annual Taxes
- $2,513
Year Built
- Built in 2005
Lot Details
- 4.89 Acre Lot
- Property fronts a county road
- Chain Link Fence
- Rectangular Lot
- Wooded Lot
- Landscaped with Trees
- Property is zoned R1
Parking
- 2 Car Attached Garage
- Driveway
Home Design
- Contemporary Architecture
- Block Foundation
- Slab Foundation
- Shingle Roof
- Ridge Vents on the Roof
- Asphalt Roof
- Stucco
Interior Spaces
- 2,393 Sq Ft Home
- 1-Story Property
- Tray Ceiling
- Single Hung Windows
- Fire and Smoke Detector
Kitchen
- Breakfast Area or Nook
- Electric Oven
- Electric Range
- Dishwasher
- Solid Wood Cabinet
Flooring
- Carpet
- Laminate
Bedrooms and Bathrooms
- 3 Bedrooms
- Walk-In Closet
- 2 Full Bathrooms
- Dual Sinks
- Bathtub with Shower
- Garden Bath
- Separate Shower
Laundry
- Laundry in unit
- Washer
Pool
- Room in yard for a pool
Schools
- Hernando Elementary School
- Citrus Springs Middle School
- Lecanto High School
Utilities
- Central Air
- Heat Pump System
- Programmable Thermostat
- Well
- Water Heater
- Septic Tank
Community Details
- No Home Owners Association
- Forest Lake Subdivision
3D Interior and Exterior Tours
Floorplan
Map
Create a Home Valuation Report for This Property
The Home Valuation Report is an in-depth analysis detailing your home's value as well as a comparison with similar homes in the area
Home Values in the Area
Average Home Value in this Area
Tax History
| Year | Tax Paid | Tax Assessment Tax Assessment Total Assessment is a certain percentage of the fair market value that is determined by local assessors to be the total taxable value of land and additions on the property. | Land | Improvement |
|---|---|---|---|---|
| 2025 | $2,513 | $202,265 | -- | -- |
| 2024 | $2,451 | $196,565 | -- | -- |
| 2023 | $2,451 | $190,840 | $0 | $0 |
| 2022 | $2,296 | $185,282 | $0 | $0 |
| 2021 | $2,204 | $179,885 | $0 | $0 |
| 2020 | $2,104 | $250,274 | $44,510 | $205,764 |
| 2019 | $2,076 | $233,627 | $45,500 | $188,127 |
| 2018 | $2,050 | $225,203 | $38,500 | $186,703 |
| 2017 | $2,043 | $166,680 | $44,530 | $122,150 |
| 2016 | $2,068 | $163,252 | $44,530 | $118,722 |
| 2015 | $2,144 | $162,117 | $44,530 | $117,587 |
| 2014 | $2,144 | $160,830 | $38,928 | $121,902 |
Source: Public Records
Property History
| Date | Event | Price | List to Sale | Price per Sq Ft |
|---|---|---|---|---|
| 02/28/2026 02/28/26 | Pending | -- | -- | -- |
| 11/19/2025 11/19/25 | Price Changed | $549,900 | -8.2% | $230 / Sq Ft |
| 07/27/2025 07/27/25 | For Sale | $599,000 | -- | $250 / Sq Ft |
Source: REALTORS® Association of Citrus County
Purchase History
| Date | Type | Sale Price | Title Company |
|---|---|---|---|
| Interfamily Deed Transfer | -- | Attorney | |
| Warranty Deed | -- | First Title Company Inc | |
| Interfamily Deed Transfer | -- | First Title Company Inc | |
| Warranty Deed | $25,500 | First Title Company Inc | |
| Deed | $100 | -- | |
| Deed | $100 | -- | |
| Deed | $18,500 | -- | |
| Deed | $7,000 | -- |
Source: Public Records
About the Listing Agent
James (JR) Martin received his real estate salesperson license in 1985 while attending college in California and started his career with Coldwell Banker in Roseville, CA. Spanning more than 40 years now, JR has managed, developed, built, sold, bought, and leased hundreds of industrial, residential, retail, and office properties for himself and a long list of investors in California and Florida. In 1995, JR became a licensed broker and in 2008 he received his general contractor's license. In
JR's Other Listings
Source: REALTORS® Association of Citrus County
MLS Number: 846702
APN: 19E-18S-15-0010-00020-1100
Disclaimer: Certain information contained herein is derived from information provided by parties other than Homes.com. All information provided is deemed reliable, but is not guaranteed to be accurate and should be independently verified.
![]() IDX information is provided exclusively for personal, non-commercial use, and may not be used for any purpose other than to identify prospective properties consumers may be interested in purchasing.
IDX information is provided exclusively for personal, non-commercial use, and may not be used for any purpose other than to identify prospective properties consumers may be interested in purchasing.
Information is deemed reliable but not guaranteed.
Nearby Homes
- 1215 E Getty Ln
- 1255 E Rockefeller Ln
- 1576 E Cleveland St
- 1264 E Getty Ln
- 1263 E Getty Ln
- 1640 E Westgate Ln
- 1012 & 1030 E Mckinley St
- 1724 E Mckinley St
- 3157 N Hamlin Terrace
- 3921 N Longvalley Rd
- 1139 E Mckinley St
- 3905 N Longvalley Rd
- 1142 E Bismark St
- 3922 N Longvalley Rd
- 1716 E Bismark St
- 1011 E Bismark St
- 1401 E Bismark St
- 3366 N Annapolis Ave
- 4160 N Indianriver Dr
- 3292 N Annapolis Ave
Your Personal Tour Guide
Ask me questions while you tour the home.