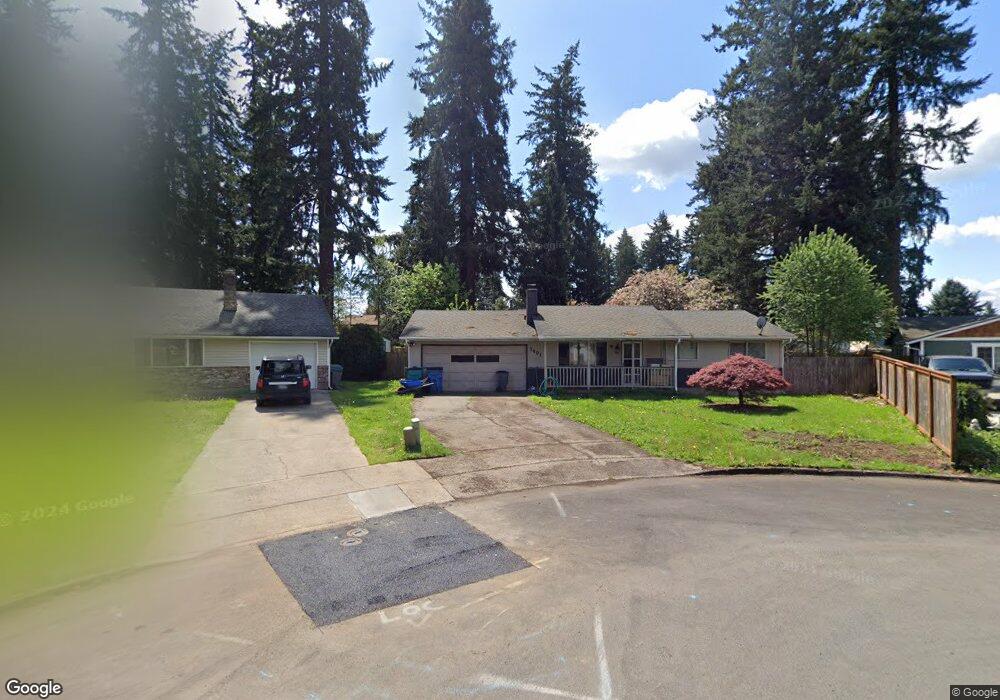
3401 NE Powers Ct Vancouver, WA 98682
Parkside NeighborhoodEstimated Value: $379,000 - $425,000
3
Beds
2
Baths
988
Sq Ft
$414/Sq Ft
Est. Value
About This Home
This home is located at 3401 NE Powers Ct, Vancouver, WA 98682 and is currently estimated at $409,072, approximately $414 per square foot. 3401 NE Powers Ct is a home located in Clark County with nearby schools including Burton Elementary School, Cascade Middle School, and Evergreen High School.
Ownership History
Date
Name
Owned For
Owner Type
Purchase Details
Closed on
Jul 21, 2011
Sold by
The Secretary Of Housing & Urban Develop
Bought by
Cochran Alex
Current Estimated Value
Home Financials for this Owner
Home Financials are based on the most recent Mortgage that was taken out on this home.
Original Mortgage
$110,342
Interest Rate
4.4%
Mortgage Type
FHA
Purchase Details
Closed on
Apr 26, 2011
Sold by
Midfirst Bank
Bought by
The Secretary Of Housing & Urban Develop
Purchase Details
Closed on
Jun 9, 2000
Sold by
Sweet Cynthia M
Bought by
Challenor Conrad J
Home Financials for this Owner
Home Financials are based on the most recent Mortgage that was taken out on this home.
Original Mortgage
$134,561
Interest Rate
8.15%
Mortgage Type
FHA
Purchase Details
Closed on
Feb 23, 2000
Sold by
Smith Doyal D and Sweet Cynthia M
Bought by
Sweet Cynthia M
Home Financials for this Owner
Home Financials are based on the most recent Mortgage that was taken out on this home.
Original Mortgage
$13,500
Interest Rate
8.16%
Create a Home Valuation Report for This Property
The Home Valuation Report is an in-depth analysis detailing your home's value as well as a comparison with similar homes in the area
Home Values in the Area
Average Home Value in this Area
Purchase History
| Date | Buyer | Sale Price | Title Company |
|---|---|---|---|
| Cochran Alex | -- | First American Title | |
| The Secretary Of Housing & Urban Develop | -- | Lsi Title Company | |
| Midfirst Bank | $141,723 | None Available | |
| Challenor Conrad J | $135,500 | Clark County Title Company | |
| Sweet Cynthia M | -- | Clark County Title Company |
Source: Public Records
Mortgage History
| Date | Status | Borrower | Loan Amount |
|---|---|---|---|
| Previous Owner | Cochran Alex | $110,342 | |
| Previous Owner | Challenor Conrad J | $134,561 | |
| Previous Owner | Sweet Cynthia M | $13,500 |
Source: Public Records
Tax History Compared to Growth
Tax History
| Year | Tax Paid | Tax Assessment Tax Assessment Total Assessment is a certain percentage of the fair market value that is determined by local assessors to be the total taxable value of land and additions on the property. | Land | Improvement |
|---|---|---|---|---|
| 2025 | $3,584 | $371,383 | $199,500 | $171,883 |
| 2024 | $3,577 | $361,036 | $199,500 | $161,536 |
| 2023 | $3,540 | $373,785 | $199,500 | $174,285 |
| 2022 | $3,128 | $365,526 | $199,500 | $166,026 |
| 2021 | $2,941 | $306,356 | $168,000 | $138,356 |
| 2020 | $2,717 | $272,221 | $150,000 | $122,221 |
| 2019 | $2,385 | $253,907 | $130,275 | $123,632 |
| 2018 | $2,462 | $240,042 | $0 | $0 |
| 2017 | $2,202 | $199,128 | $0 | $0 |
| 2016 | $2,025 | $184,412 | $0 | $0 |
| 2015 | $1,956 | $162,405 | $0 | $0 |
| 2014 | -- | $149,969 | $0 | $0 |
| 2013 | -- | $132,166 | $0 | $0 |
Source: Public Records
Map
Nearby Homes
- 3400 NE Powers Ct
- 3211 NE 141st Ave
- 13815 NE 33rd Cir
- 3101 NE 138th Ave
- 3202 NE 150th Ave
- 14908 NE 28th St
- 4014 NE 141st Ave
- 14912 NE 39th St
- 2836 NE 137th Ct
- 15321 NE 31st St
- 2419 NE 151st Ave
- 4517 NE 142nd Ave
- 15021 NE 24th St
- 4315 NE 135th Ave
- 13401 NE 28th St Unit 407
- 13100 NE 30th Cir
- 4403 NE 152nd Ave
- 13604 NE 22nd St Unit 14
- 2105 NE 136th Ave Unit 9
- 13513 NE 22nd St Unit 3
- 3409 NE Powers Ct
- 3221 NE 143rd Ave
- 3413 NE Powers Ct
- 3219 NE 143rd Ave
- 3223 NE 143rd Ave
- 3412 NE Powers Ct
- 3421 NE Powers Ct
- 3416 NE Powers Ct
- 3400 NE 145th Ave
- 14413 NE Powers St
- 3406 NE 145th Ave
- 3317 NE 143rd Ave
- 3401 NE 143rd Ave
- 14317 NE Powers St
- 3301 NE 143rd Ave
- 3311 NE 143rd Ave
- 3305 NE 143rd Ave
- 3407 NE 143rd Ave
- 3215 NE 143rd Ave
- 14421 NE Powers St