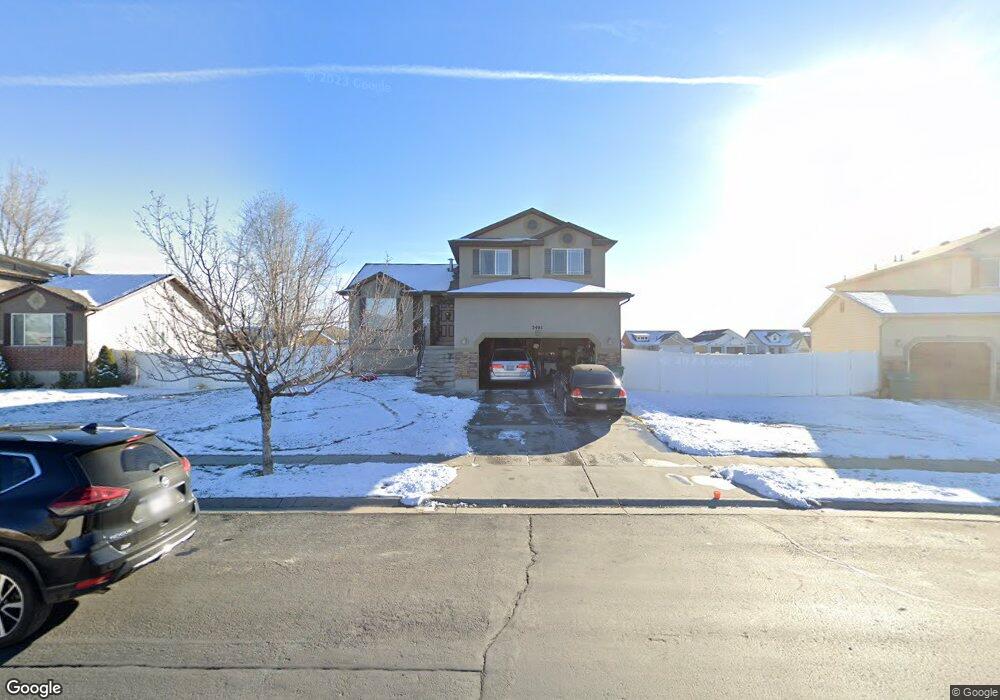
3401 W 4150 S West Haven, UT 84401
Estimated Value: $528,527 - $566,000
3
Beds
2
Baths
2,183
Sq Ft
$251/Sq Ft
Est. Value
About This Home
This home is located at 3401 W 4150 S, West Haven, UT 84401 and is currently estimated at $548,632, approximately $251 per square foot. 3401 W 4150 S is a home located in Weber County with nearby schools including West Haven School, Sand Ridge Junior High School, and Roy High School.
Ownership History
Date
Name
Owned For
Owner Type
Purchase Details
Closed on
Nov 21, 2012
Sold by
Baker Melanie D and Wayman Melanie D
Bought by
Wayman Melanie D
Current Estimated Value
Home Financials for this Owner
Home Financials are based on the most recent Mortgage that was taken out on this home.
Original Mortgage
$167,500
Outstanding Balance
$115,526
Interest Rate
3.35%
Mortgage Type
New Conventional
Estimated Equity
$433,106
Purchase Details
Closed on
Sep 25, 2008
Sold by
Baker Melanie and Baker Rex J
Bought by
Baker Melanie D
Home Financials for this Owner
Home Financials are based on the most recent Mortgage that was taken out on this home.
Original Mortgage
$168,400
Interest Rate
6.43%
Mortgage Type
Stand Alone Refi Refinance Of Original Loan
Purchase Details
Closed on
Dec 12, 2005
Sold by
Woodside Rosewood Llc
Bought by
Baker Melanie
Home Financials for this Owner
Home Financials are based on the most recent Mortgage that was taken out on this home.
Original Mortgage
$166,771
Interest Rate
6.35%
Mortgage Type
FHA
Create a Home Valuation Report for This Property
The Home Valuation Report is an in-depth analysis detailing your home's value as well as a comparison with similar homes in the area
Home Values in the Area
Average Home Value in this Area
Purchase History
| Date | Buyer | Sale Price | Title Company |
|---|---|---|---|
| Wayman Melanie D | -- | Surety Title | |
| Baker Melanie D | -- | Mountain View Title Ogden | |
| Baker Melanie | -- | Us Title Of Utah Ogden |
Source: Public Records
Mortgage History
| Date | Status | Borrower | Loan Amount |
|---|---|---|---|
| Open | Wayman Melanie D | $167,500 | |
| Closed | Baker Melanie D | $168,400 | |
| Closed | Baker Melanie | $166,771 |
Source: Public Records
Tax History Compared to Growth
Tax History
| Year | Tax Paid | Tax Assessment Tax Assessment Total Assessment is a certain percentage of the fair market value that is determined by local assessors to be the total taxable value of land and additions on the property. | Land | Improvement |
|---|---|---|---|---|
| 2025 | $2,998 | $485,450 | $179,990 | $305,460 |
| 2024 | $2,868 | $262,899 | $98,994 | $163,905 |
| 2023 | $2,967 | $273,900 | $98,966 | $174,934 |
| 2022 | $2,849 | $269,500 | $88,001 | $181,499 |
| 2021 | $2,432 | $385,000 | $94,985 | $290,015 |
| 2020 | $2,340 | $339,000 | $75,027 | $263,973 |
| 2019 | $2,233 | $305,000 | $65,016 | $239,984 |
| 2018 | $2,204 | $288,000 | $59,941 | $228,059 |
| 2017 | $2,006 | $253,000 | $60,082 | $192,918 |
| 2016 | $1,790 | $120,898 | $32,985 | $87,913 |
| 2015 | $1,734 | $116,688 | $32,961 | $83,727 |
| 2014 | $1,627 | $106,406 | $32,961 | $73,445 |
Source: Public Records
Map
Nearby Homes
- 4317 S 3350 W
- 3542 W 4200 S
- 4351 W 4000 S
- 4124 S 3560 W
- 3554 W 4100 S Unit 63
- 3385 W 3950 S
- 3960 S 3375 W
- 3959 S 3485 W
- 3942 S 3450 W
- 4440 Stone Creek Rd Unit 2E
- 4045 S 3600 W
- 3555 W 3900 S
- 3367 W 3785 S
- 4491 Haven Creek Rd Unit A
- 3229 W 3855 S
- 3835 S 3250 W
- 3829 S 3250 W
- 3434 W 4525 S
- 3329 W 3745 S
- 3327 W 3745 S Unit 4050
- 3389 W 4150 S
- 3413 W 4150 S
- 3377 W 4150 S
- 4143 S 3375 W
- 3414 W 4150 S
- 3423 W 4150 S
- 3361 W 4150 S
- 4129 S 3375 W
- 4142 S 3375 W
- 3385 W Sophie Ln
- 4128 S 3425 W
- 3409 W Sophie Ln
- 3377 W Sophie Ln
- 3361 W Sophie Ln
- 3393 Sophie Ln Unit 11
- 3349 W 4150 S
- 3401 Sophie Ln
- 3401 Sophie Ln Unit 10
- 4132 S 3375 W
- 4119 S 3375 W