3402 E Smith Rd Medina, OH 44256
Estimated Value: $396,448 - $481,000
About This Home
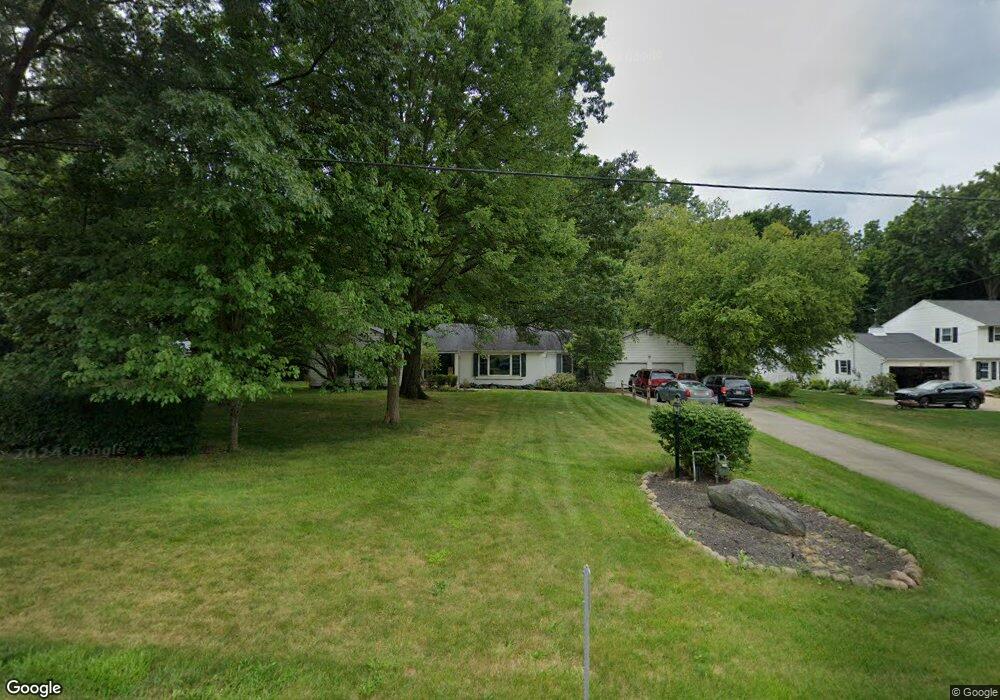
This home is located at 3402 E Smith Rd, Medina, OH 44256 and is currently estimated at $435,862, approximately $186 per square foot. 3402 E Smith Rd is a home located in Medina County with nearby schools including Sidney Fenn Elementary School, Claggett Middle School, and Medina High School.
Ownership History
We collect this data history from publicly available records. To have your information removed, we recommend requesting removal directly through your county’s website.
Purchase Details
Home Financials for this Owner
Home Financials are based on the most recent Mortgage that was taken out on this home.Purchase Details
Home Financials for this Owner
Home Financials are based on the most recent Mortgage that was taken out on this home.Purchase Details
Purchase Details
Home Values in the Area
Average Home Value in this Area
Purchase History
We collect this data history from publicly available records. To have your information removed, we recommend requesting removal directly through your county’s website.
| Date | Buyer | Sale Price | Title Company |
|---|---|---|---|
| $246,500 | None Available | ||
| $240,000 | Mcta | ||
| -- | -- | ||
| $199,000 | -- |
Mortgage History
We collect this data history from publicly available records. To have your information removed, we recommend requesting removal directly through your county’s website.
| Date | Status | Borrower | Loan Amount |
|---|---|---|---|
| Closed | $196,500 | ||
| Closed | $190,000 |
Tax History
We collect this data history from publicly available records. To have your information removed, we recommend requesting removal directly through your county’s website.
| Year | Tax Paid | Tax Assessment Tax Assessment Total Assessment is a certain percentage of the fair market value that is determined by local assessors to be the total taxable value of land and additions on the property. | Land | Improvement |
|---|---|---|---|---|
| 2025 | $6,161 | $119,520 | $33,130 | $86,390 |
| 2024 | $6,161 | $92,610 | $30,930 | $61,680 |
| 2023 | $6,070 | $92,610 | $30,930 | $61,680 |
| 2022 | $4,973 | $92,610 | $30,930 | $61,680 |
| 2021 | $4,664 | $73,500 | $24,550 | $48,950 |
| 2020 | $4,683 | $73,500 | $24,550 | $48,950 |
| 2019 | $4,691 | $73,500 | $24,550 | $48,950 |
| 2018 | $5,029 | $74,160 | $26,340 | $47,820 |
| 2017 | $5,100 | $74,160 | $26,340 | $47,820 |
| 2016 | $5,149 | $74,160 | $26,340 | $47,820 |
| 2015 | $5,053 | $69,310 | $24,620 | $44,690 |
| 2014 | $4,978 | $69,310 | $24,620 | $44,690 |
| 2013 | $4,984 | $69,310 | $24,620 | $44,690 |
Map
- 3395 Forest Hills Dr
- 3227 Rustic Valley Dr
- 3148 N Park Ln
- 4122 E Normandy Park Dr Unit 107
- 5514 Hideaway Dr
- 5531 Hideaway Dr Unit 52
- 3115 Benwick Dr
- 2996 Pondsford Dr
- 3089 Pondsford Dr
- 3573 Autumn Tree Dr
- 3382 Hardwood Hollow Rd
- 5355 Coventry Park Ln
- 4860 Nettleton Rd
- 3029 Marla Ct
- 2886 Parnham Dr
- 2770 Hillsong Dr
- 2745 Hillsong Dr
- 2796 Hillsong Dr
- 3689 Turnberry Dr
- 3561 Old Hickory Ln
- 3414 E Smith Rd
- 3390 E Smith Rd
- 3426 E Smith Rd
- 3376 E Smith Rd
- 3399 E Smith Rd
- 3364 E Smith Rd
- 3438 E Smith Rd
- 3417 E Smith Rd
- 5313 River Styx Rd
- 3350 E Smith Rd
- 3441 E Smith Rd
- 3452 E Smith Rd
- 3377 Forest Hills Dr
- 3385 Forest Hills Dr
- 5329 River Styx Rd
- 3414 Forest Lake Dr
- 3340 E Smith Rd
- 5341 River Styx Rd
- 3436 Forest Lake Dr
- 3351 E Smith Rd
Ask me questions while you tour the home.