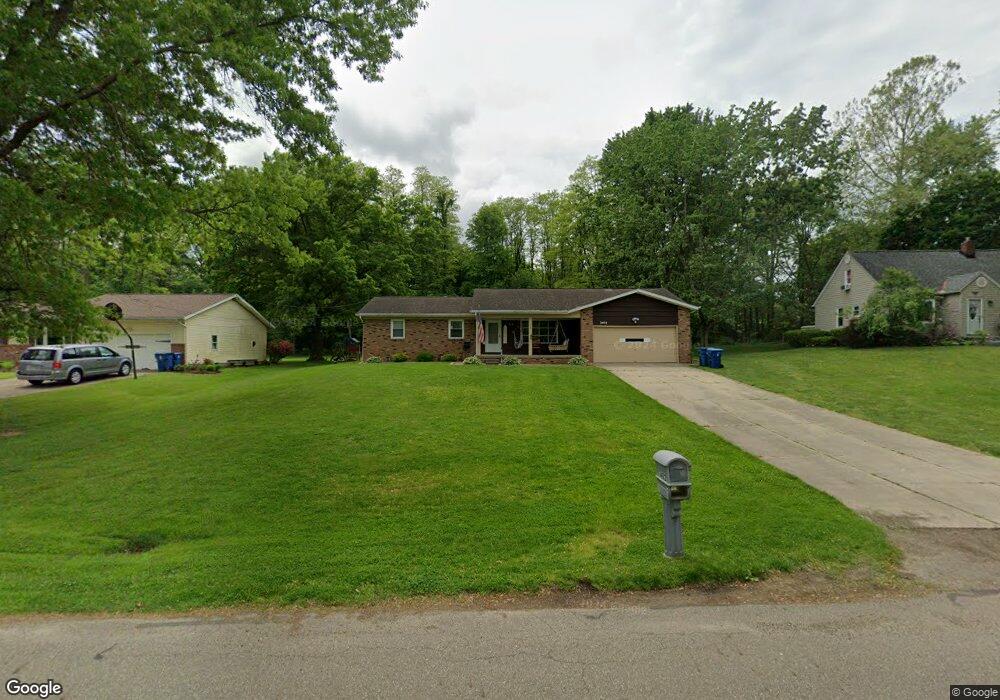
3402 Huntsberger St Norton, OH 44203
North Barberton NeighborhoodEstimated Value: $200,000 - $242,000
3
Beds
2
Baths
1,562
Sq Ft
$142/Sq Ft
Est. Value
About This Home
This home is located at 3402 Huntsberger St, Norton, OH 44203 and is currently estimated at $222,309, approximately $142 per square foot. 3402 Huntsberger St is a home located in Summit County with nearby schools including Barberton Middle School, Barberton Intermediate School 3-5, and Barberton High School.
Ownership History
Date
Name
Owned For
Owner Type
Purchase Details
Closed on
Aug 7, 2025
Sold by
Duncan William Richard
Bought by
Duncan William Richard and Duncan Megan E
Current Estimated Value
Purchase Details
Closed on
Oct 2, 2020
Sold by
Harvey Woodrow C and Harvey Kathryn L
Bought by
Duncan William Richard
Home Financials for this Owner
Home Financials are based on the most recent Mortgage that was taken out on this home.
Original Mortgage
$152,192
Interest Rate
2.71%
Mortgage Type
FHA
Purchase Details
Closed on
Oct 18, 2002
Sold by
Lattea Emlouis B and Lattea Donna L
Bought by
Harvey Woodrow C and Harvey Kathryn L
Home Financials for this Owner
Home Financials are based on the most recent Mortgage that was taken out on this home.
Original Mortgage
$106,400
Interest Rate
6.24%
Create a Home Valuation Report for This Property
The Home Valuation Report is an in-depth analysis detailing your home's value as well as a comparison with similar homes in the area
Home Values in the Area
Average Home Value in this Area
Purchase History
| Date | Buyer | Sale Price | Title Company |
|---|---|---|---|
| Duncan William Richard | -- | None Listed On Document | |
| Duncan William Richard | $155,000 | None Available | |
| Harvey Woodrow C | $133,000 | Titleco Title Agency |
Source: Public Records
Mortgage History
| Date | Status | Borrower | Loan Amount |
|---|---|---|---|
| Previous Owner | Duncan William Richard | $152,192 | |
| Previous Owner | Harvey Woodrow C | $106,400 |
Source: Public Records
Tax History Compared to Growth
Tax History
| Year | Tax Paid | Tax Assessment Tax Assessment Total Assessment is a certain percentage of the fair market value that is determined by local assessors to be the total taxable value of land and additions on the property. | Land | Improvement |
|---|---|---|---|---|
| 2025 | $3,451 | $63,071 | $16,860 | $46,211 |
| 2024 | $3,451 | $63,071 | $16,860 | $46,211 |
| 2023 | $3,451 | $63,071 | $16,860 | $46,211 |
| 2022 | $2,575 | $40,660 | $10,808 | $29,852 |
| 2021 | $2,269 | $44,506 | $10,808 | $33,698 |
| 2020 | $2,140 | $44,510 | $10,810 | $33,700 |
| 2019 | $2,420 | $45,120 | $8,640 | $36,480 |
| 2018 | $2,385 | $45,120 | $8,640 | $36,480 |
| 2017 | $2,334 | $45,120 | $8,640 | $36,480 |
| 2016 | $2,339 | $43,690 | $8,640 | $35,050 |
| 2015 | $2,334 | $43,690 | $8,640 | $35,050 |
| 2014 | $2,322 | $43,690 | $8,640 | $35,050 |
| 2013 | $2,746 | $42,840 | $8,640 | $34,200 |
Source: Public Records
Map
Nearby Homes
- 645 Madison Ave
- 217 W Summit St
- 250 Evergreen St
- 213 Hermann St
- 690 Saint Clair Ave
- 103 Mitchell St
- 146 Hermann St
- 137 Hermann St
- 1960 Newton St
- 1924 Caroline Ave
- 44 W Summit St
- 0 Wooster Rd N
- 613 Wooster Rd N
- 818 N Summit St
- 30 W Hiram St
- 277 Glenn St
- 387 4th St NW
- 46 Brown St
- 143 Glenn St
- 412 Grandview Ave
- 3414 Huntsberger St
- 3374 Huntsberger St
- 3424 Huntsberger St
- 3380 Huntsberger St
- 3440 Huntsberger St
- 725 Wesleyan Ave
- 729 Wesleyan Ave
- 3381 Huntsberger St
- 707 Wesleyan Ave
- 739 Wesleyan Ave
- 695 Wesleyan Ave
- 747 Wesleyan Ave
- 3361 Huntsberger St
- 3411 Huntsberger St
- 687 Wesleyan Ave
- 679 Wesleyan Ave
- 3333 Huntsberger St
- 3450 Huntsberger St
- 3460 Huntsberger St
- 726 Wesleyan Ave