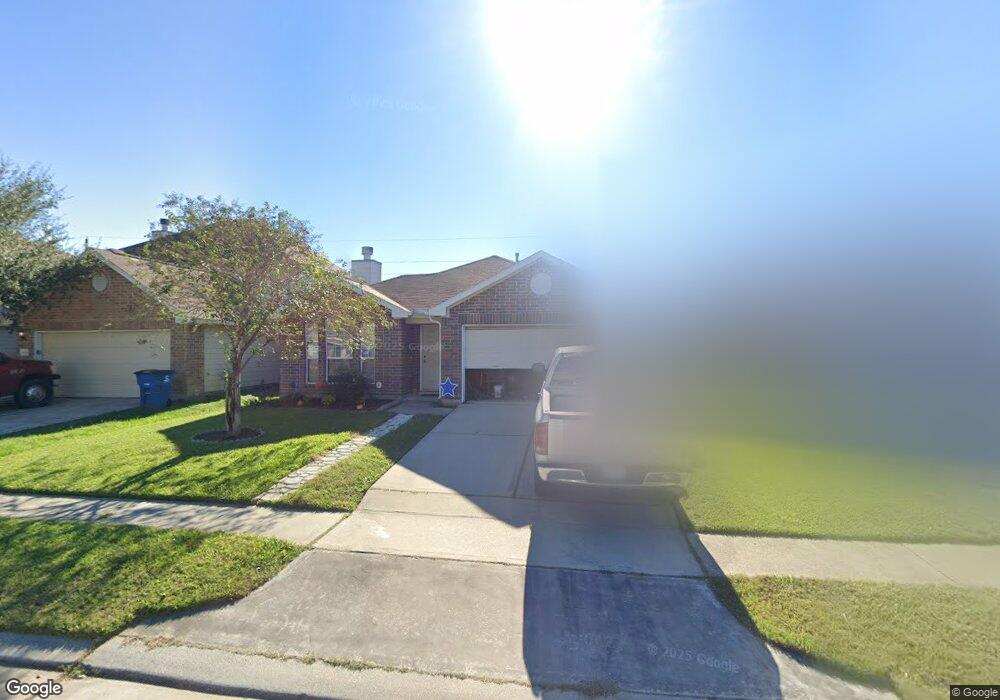
3402 Owl Crossing Ln Humble, TX 77338
Estimated Value: $213,000 - $232,000
3
Beds
2
Baths
1,763
Sq Ft
$124/Sq Ft
Est. Value
About This Home
This home is located at 3402 Owl Crossing Ln, Humble, TX 77338 and is currently estimated at $218,168, approximately $123 per square foot. 3402 Owl Crossing Ln is a home located in Harris County with nearby schools including Ogden Elementary School, Nimitz Ninth Grade School, and Teague Middle School.
Ownership History
Date
Name
Owned For
Owner Type
Purchase Details
Closed on
May 23, 2013
Sold by
The Secretary Of Hud Of Washington Dc
Bought by
Alridge Kim
Current Estimated Value
Home Financials for this Owner
Home Financials are based on the most recent Mortgage that was taken out on this home.
Original Mortgage
$93,480
Outstanding Balance
$66,151
Interest Rate
3.45%
Mortgage Type
FHA
Estimated Equity
$152,017
Purchase Details
Closed on
Jul 17, 2012
Sold by
Bank Of America Na
Bought by
Secretary Of Hud
Purchase Details
Closed on
Jul 3, 2012
Sold by
Garza Oscar J
Bought by
Bank Of America Na
Purchase Details
Closed on
Sep 20, 2007
Sold by
Gateway Homes Ltd
Bought by
Garza Oscar J
Home Financials for this Owner
Home Financials are based on the most recent Mortgage that was taken out on this home.
Original Mortgage
$111,320
Interest Rate
6.55%
Mortgage Type
FHA
Create a Home Valuation Report for This Property
The Home Valuation Report is an in-depth analysis detailing your home's value as well as a comparison with similar homes in the area
Home Values in the Area
Average Home Value in this Area
Purchase History
| Date | Buyer | Sale Price | Title Company |
|---|---|---|---|
| Alridge Kim | -- | None Available | |
| Secretary Of Hud | -- | None Available | |
| Bank Of America Na | -- | None Available | |
| Garza Oscar J | -- | None Available |
Source: Public Records
Mortgage History
| Date | Status | Borrower | Loan Amount |
|---|---|---|---|
| Open | Alridge Kim | $93,480 | |
| Previous Owner | Garza Oscar J | $111,320 |
Source: Public Records
Tax History Compared to Growth
Tax History
| Year | Tax Paid | Tax Assessment Tax Assessment Total Assessment is a certain percentage of the fair market value that is determined by local assessors to be the total taxable value of land and additions on the property. | Land | Improvement |
|---|---|---|---|---|
| 2025 | $3,620 | $183,056 | $46,170 | $136,886 |
| 2024 | $3,620 | $184,767 | $46,170 | $138,597 |
| 2023 | $3,620 | $189,908 | $46,170 | $143,738 |
| 2022 | $4,464 | $170,649 | $23,085 | $147,564 |
| 2021 | $4,277 | $143,488 | $23,085 | $120,403 |
| 2020 | $5,176 | $167,213 | $23,085 | $144,128 |
| 2019 | $4,924 | $161,893 | $23,085 | $138,808 |
| 2018 | $1,270 | $153,556 | $23,085 | $130,471 |
| 2017 | $3,937 | $153,556 | $23,085 | $130,471 |
| 2016 | $3,579 | $133,493 | $23,085 | $110,408 |
| 2015 | $2,864 | $133,493 | $23,085 | $110,408 |
| 2014 | $2,864 | $94,779 | $23,085 | $71,694 |
Source: Public Records
Map
Nearby Homes
- 3318 Owl Crossing Ln
- 3434 Fiorella Way
- 3327 Bluebird Park Ln
- 21603 Micheala Way
- 21514 Haylee Way
- 3334 Maris Way
- 21626 Trilby Way
- 3706 Arbor Trails Dr
- 3715 Arbor Trails Dr
- 3723 Arbor Trails Dr
- 2934 Cypress Island Dr
- 3039 Cypress Island Dr
- 21919 Siberian Elm Ln
- 2827 Cypress Island Dr
- 21526 N Werrington Way
- 21819 Yucca Tip Ln
- 21406 N Werrington Way
- 2639 Cypress Island Dr
- 21431 Ryans Path Ln
- 3000 Titleist Dr
- 3406 Owl Crossing Ln
- 3326 Owl Crossing Ln
- 3410 Owl Crossing Ln
- 3403 Owl Crossing Ln
- 3407 Owl Crossing Ln
- 3322 Owl Crossing Ln
- 3414 Owl Crossing Ln
- 3319 Owl Crossing Ln
- 3407 Fiorella Way
- 3403 Fiorella Way
- 3315 Owl Crossing Ln
- 3411 Fiorella Way
- 3418 Owl Crossing Ln
- 3411 Owl Crossing Ln
- 3347 Fiorella Way
- 3415 Fiorella Way
- 3311 Owl Crossing Ln
- 3343 Fiorella Way
- 3422 Owl Crossing Ln
- 3314 Owl Crossing Ln