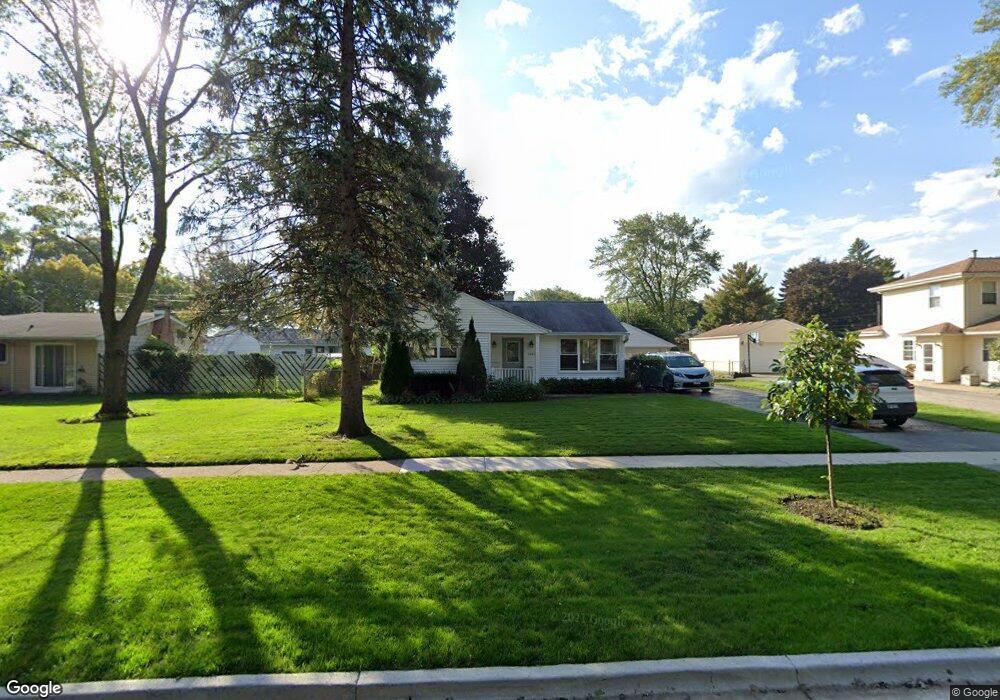
3402 Sigwalt St Rolling Meadows, IL 60008
Estimated Value: $312,416 - $356,000
3
Beds
2
Baths
1,003
Sq Ft
$329/Sq Ft
Est. Value
About This Home
This home is located at 3402 Sigwalt St, Rolling Meadows, IL 60008 and is currently estimated at $329,604, approximately $328 per square foot. 3402 Sigwalt St is a home located in Cook County with nearby schools including Kimball Hill Elementary School, Carl Sandburg Junior High School, and Rolling Meadows High School.
Ownership History
Date
Name
Owned For
Owner Type
Purchase Details
Closed on
Sep 17, 2015
Sold by
Gioe Frank P
Bought by
Gioe Living Trust
Current Estimated Value
Purchase Details
Closed on
Jun 17, 2008
Sold by
Reehoff George Bryan and Reehoff Lynda J
Bought by
Gioe Frank P
Home Financials for this Owner
Home Financials are based on the most recent Mortgage that was taken out on this home.
Original Mortgage
$247,000
Outstanding Balance
$155,685
Interest Rate
5.96%
Mortgage Type
Unknown
Estimated Equity
$173,919
Purchase Details
Closed on
Jan 11, 2007
Sold by
Christopher Carol I
Bought by
Reehoff George Bryan and Reehoff Lynda J
Home Financials for this Owner
Home Financials are based on the most recent Mortgage that was taken out on this home.
Original Mortgage
$163,800
Interest Rate
8.25%
Mortgage Type
Unknown
Create a Home Valuation Report for This Property
The Home Valuation Report is an in-depth analysis detailing your home's value as well as a comparison with similar homes in the area
Home Values in the Area
Average Home Value in this Area
Purchase History
| Date | Buyer | Sale Price | Title Company |
|---|---|---|---|
| Gioe Living Trust | -- | Attorney | |
| Gioe Frank P | $260,000 | Ticor Title | |
| Reehoff George Bryan | $182,000 | Ticor Title Ins Co 2002 |
Source: Public Records
Mortgage History
| Date | Status | Borrower | Loan Amount |
|---|---|---|---|
| Open | Gioe Frank P | $247,000 | |
| Previous Owner | Reehoff George Bryan | $163,800 |
Source: Public Records
Tax History
| Year | Tax Paid | Tax Assessment Tax Assessment Total Assessment is a certain percentage of the fair market value that is determined by local assessors to be the total taxable value of land and additions on the property. | Land | Improvement |
|---|---|---|---|---|
| 2025 | $5,561 | $26,000 | $6,563 | $19,437 |
| 2024 | $5,561 | $21,462 | $5,553 | $15,909 |
| 2023 | $5,295 | $21,462 | $5,553 | $15,909 |
| 2022 | $5,295 | $21,462 | $5,553 | $15,909 |
| 2021 | $4,680 | $17,461 | $3,281 | $14,180 |
| 2020 | $4,643 | $17,461 | $3,281 | $14,180 |
| 2019 | $4,678 | $19,510 | $3,281 | $16,229 |
| 2018 | $4,760 | $18,133 | $3,029 | $15,104 |
| 2017 | $4,683 | $18,133 | $3,029 | $15,104 |
| 2016 | $4,622 | $18,133 | $3,029 | $15,104 |
| 2015 | $3,746 | $14,522 | $2,776 | $11,746 |
| 2014 | $3,674 | $14,522 | $2,776 | $11,746 |
| 2013 | $3,567 | $14,522 | $2,776 | $11,746 |
Source: Public Records
Map
Nearby Homes
- 3265 Kirchoff Rd Unit 116
- 3100 Town Square Dr Unit 308
- 3100 Town Square Dr Unit 204
- 2401 Rohlwing Rd
- 3345 Kirchoff Rd Unit 5C
- 3135 Town Square Dr Unit 401
- 2705 Park St
- 3306 Trillium Cir Unit 3001
- 3209 Trillium Cir
- 2709 Lily Ln
- 3407 Pheasant Dr
- 2600 Brookwood Way Dr Unit 316
- 2600 Brookwood Way Dr Unit 305
- 3200 Thrush Ln
- 2650 Brookwood Way Dr Unit 313
- 2650 Brookwood Way Dr Unit 108
- 3 Holyoke on Auburn
- 304 E Tall Trees Ln
- 399 Knollwood Ct
- 3710 Meadow Dr
- 3404 Sigwalt St
- 2701 Cardinal Dr
- 2703 Cardinal Dr
- 2705 Cardinal Dr
- 2700 Owl Ln
- 2702 Owl Ln
- 2801 Cardinal Dr
- 3401 Sigwalt St
- 3403 Sigwalt St
- 3405 Sigwalt St
- 2803 Cardinal Dr
- 3407 Sigwalt St
- 2704 Owl Ln
- 2605 Cardinal Dr
- 2805 Cardinal Dr
- 2704 Cardinal Dr
- 2702 Cardinal Dr
- 3409 Sigwalt St
- 2700 Cardinal Dr Unit 7
- 2701 Owl Ln Unit 7
Your Personal Tour Guide
Ask me questions while you tour the home.