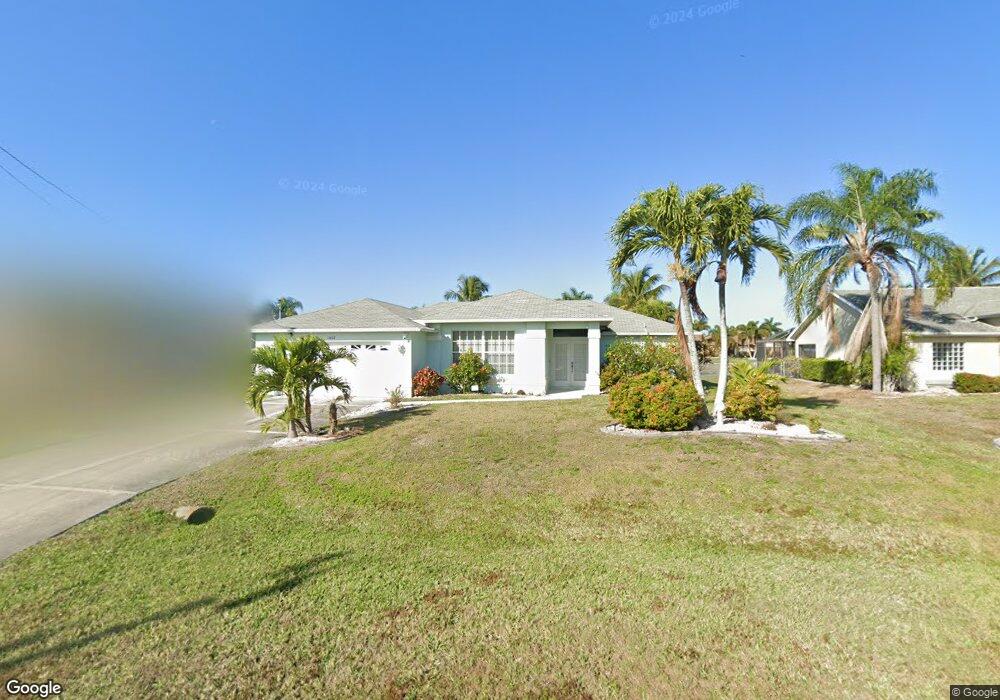
3402 SW 25th Ct Cape Coral, FL 33914
Pelican NeighborhoodEstimated Value: $394,027 - $461,000
3
Beds
2
Baths
1,685
Sq Ft
$253/Sq Ft
Est. Value
About This Home
This home is located at 3402 SW 25th Ct, Cape Coral, FL 33914 and is currently estimated at $426,257, approximately $252 per square foot. 3402 SW 25th Ct is a home located in Lee County with nearby schools including Cape Elementary School, Caloosa Elementary School, and Tropic Isles Elementary School.
Ownership History
Date
Name
Owned For
Owner Type
Purchase Details
Closed on
Dec 1, 2005
Sold by
Doerfel Gert and Doerfel Lidia
Bought by
Minacapill Lorenzo and Minacapill Marie
Current Estimated Value
Home Financials for this Owner
Home Financials are based on the most recent Mortgage that was taken out on this home.
Original Mortgage
$264,000
Outstanding Balance
$147,710
Interest Rate
6.29%
Mortgage Type
Fannie Mae Freddie Mac
Estimated Equity
$278,547
Purchase Details
Closed on
Jun 14, 2004
Sold by
Wendt Georg and Wendt Elke
Bought by
Doerfel Gert and Doerfel Lidia
Purchase Details
Closed on
Jan 21, 2000
Sold by
Nova Capital L P
Bought by
Wendt Georg and Wendt Elke
Purchase Details
Closed on
Nov 16, 1999
Sold by
Valley James M
Bought by
Nova Capital L P and Mastercraft Homes Ltd
Purchase Details
Closed on
Nov 11, 1999
Sold by
Valley Lauriane P and Valley Maurice M
Bought by
Nova Capital L P and Mastercraft Homes Ltd
Purchase Details
Closed on
Nov 8, 1999
Sold by
Stanley Linda A
Bought by
Nova Capital L P and Mastercraft Homes Ltd
Create a Home Valuation Report for This Property
The Home Valuation Report is an in-depth analysis detailing your home's value as well as a comparison with similar homes in the area
Home Values in the Area
Average Home Value in this Area
Purchase History
| Date | Buyer | Sale Price | Title Company |
|---|---|---|---|
| Minacapill Lorenzo | $330,000 | Team Title Insurance Inc | |
| Doerfel Gert | $215,000 | Security Title & Trust Inc | |
| Wendt Georg | $125,000 | -- | |
| Nova Capital L P | -- | -- | |
| Nova Capital L P | $6,500 | -- | |
| Nova Capital L P | -- | -- |
Source: Public Records
Mortgage History
| Date | Status | Borrower | Loan Amount |
|---|---|---|---|
| Open | Minacapill Lorenzo | $264,000 |
Source: Public Records
Tax History Compared to Growth
Tax History
| Year | Tax Paid | Tax Assessment Tax Assessment Total Assessment is a certain percentage of the fair market value that is determined by local assessors to be the total taxable value of land and additions on the property. | Land | Improvement |
|---|---|---|---|---|
| 2025 | $6,446 | $326,315 | $88,825 | $201,979 |
| 2024 | $5,986 | $346,926 | -- | -- |
| 2023 | $5,986 | $304,040 | $0 | $0 |
| 2022 | $5,445 | $266,734 | $0 | $0 |
| 2021 | $4,968 | $243,119 | $42,000 | $201,119 |
| 2020 | $4,987 | $220,441 | $39,700 | $180,741 |
| 2019 | $4,881 | $206,724 | $37,800 | $168,924 |
| 2018 | $5,023 | $208,336 | $36,000 | $172,336 |
| 2017 | $4,979 | $201,076 | $30,000 | $171,076 |
| 2016 | $4,789 | $193,480 | $30,000 | $163,480 |
| 2015 | $4,562 | $168,503 | $28,600 | $139,903 |
| 2014 | $4,324 | $160,601 | $24,000 | $136,601 |
| 2013 | -- | $147,991 | $12,400 | $135,591 |
Source: Public Records
Map
Nearby Homes
- 3330 SW 25th Ct
- 3413 SW 25th Ct Unit 19
- 3321 SW 26th Place
- 3412 SW 25th Place
- 3308 SW 25th Place
- 2516 SW 35th Terrace
- 2527 SW 35th Ln
- 2528 Gleason Pkwy
- 2602 SW 36th Ln
- 2705 SW 32nd Ln
- 2527 Gleason Pkwy
- 2610 SW 32nd St
- 2601 SW 37th St
- 2718 Gleason Pkwy
- 3301 SW 28th Ave
- 2663 SW 32nd St
- 2805 SW 35th St
- 2811 SW 34th Terrace
- 2648 SW 31st Ln
- 2718 SW 37th St
- 3336 SW 25th Ct
- 3406 SW 25th Ct
- 3405 SW 25th Ct
- 3401 SW 26th Ave
- 3405 SW 26th Ave
- 3333 SW 26th Ave
- 3333 SW 26 Ave
- 3410 SW 25th Ct
- 3410 SW 25th Ct Unit 28
- 3401 SW 25th Ct
- 3409 SW 26th Ave
- 3330 SW 25th Ct Unit 21
- 3327 SW 26th Ave
- 3335 SW 25th Ct
- 3414 SW 25th Ct
- 3409 SW 25th Ct
- 3413 SW 26th Ave
- 3331 SW 25th Ct
- 3323 SW 26th Ave
- 3327 SW 25th Ct